33
/
AIzaSyB4mHJ5NPEv-XzF7P6NDYXjlkCWaeKw5bc
November 30, 2025
234210
Sao Tome and Principe
STP
true
2
1
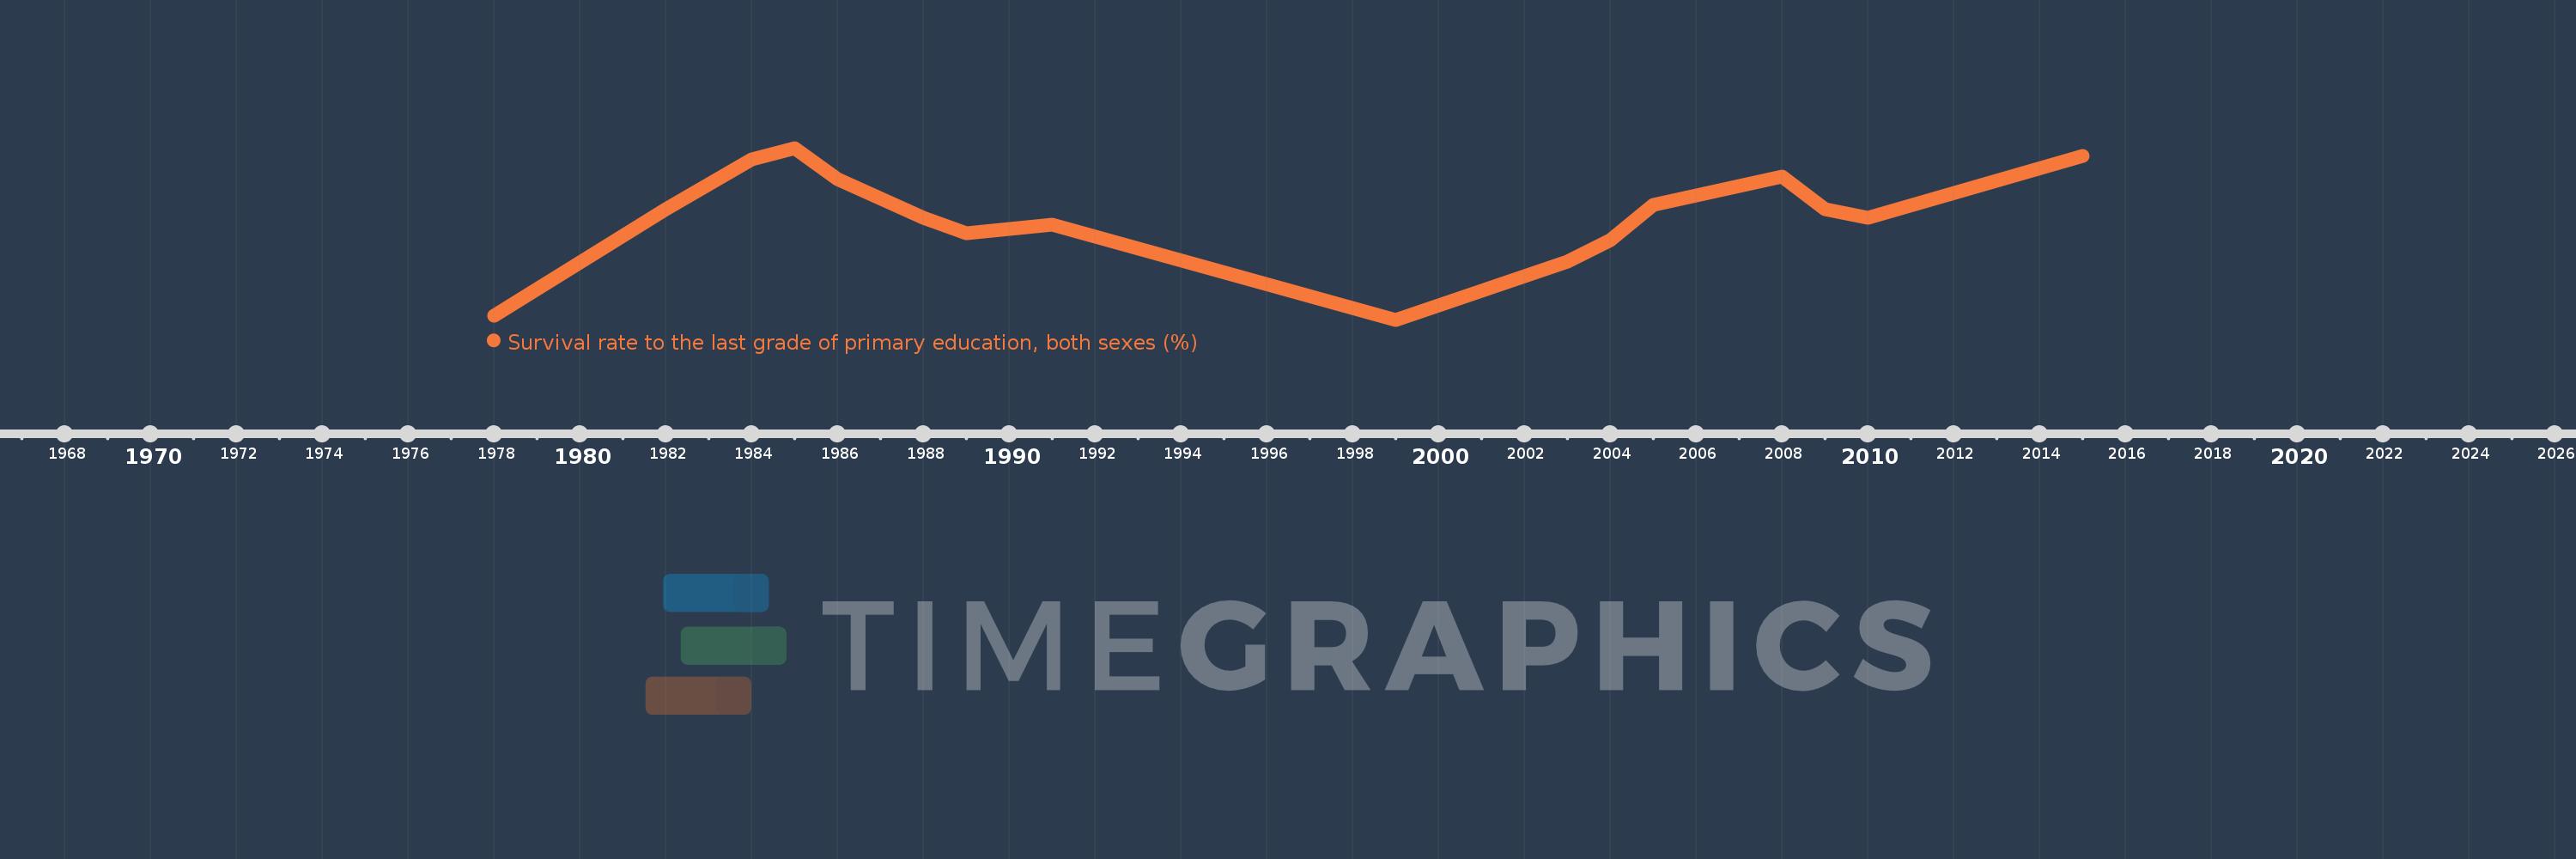
Survival rate to the last grade of primary education, both sexes (%)
2015,2010,2009,2008,2005,2004,2003,1999,1991,1989,1988,1986,1985,1984,1982,1978