33
/
AIzaSyB4mHJ5NPEv-XzF7P6NDYXjlkCWaeKw5bc
November 30, 2025
132687
Fiji
FJI
true
2
1
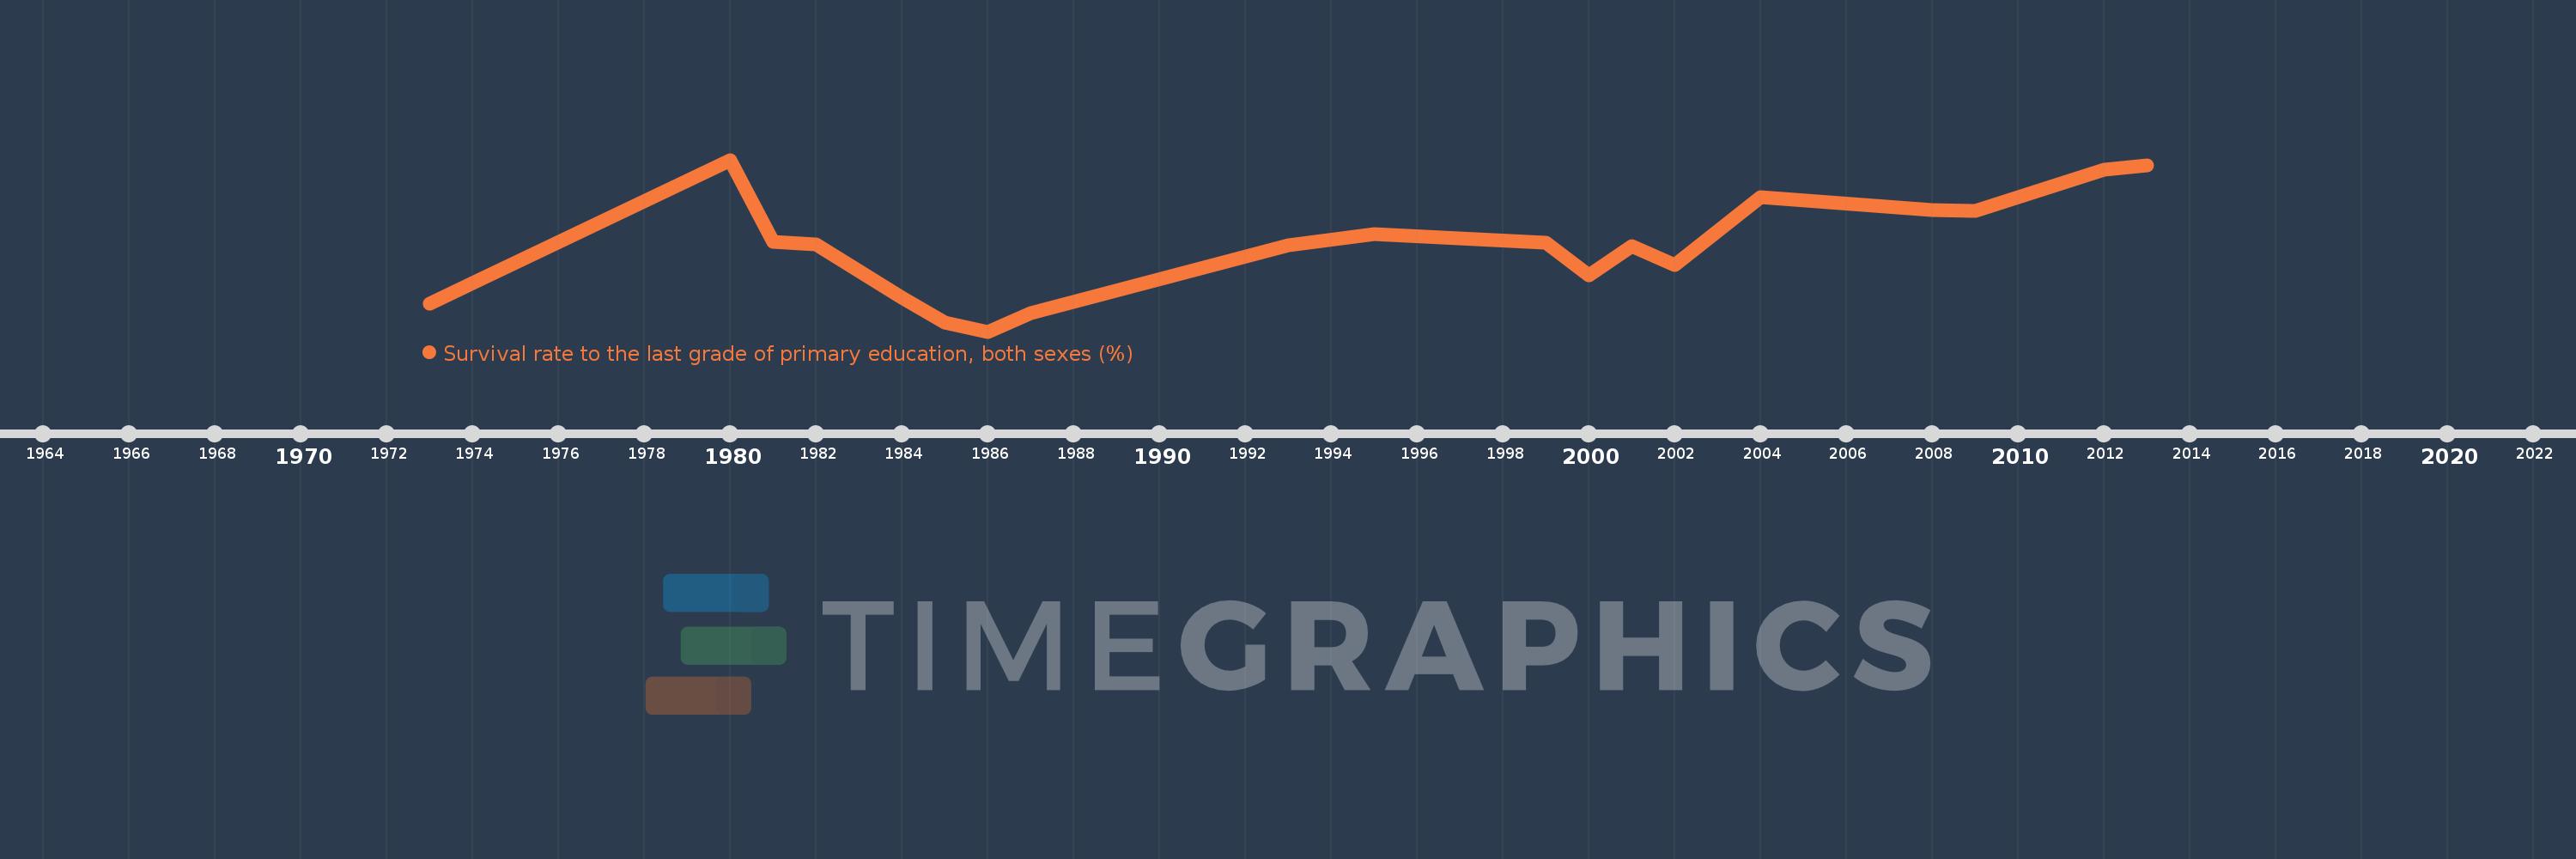
Survival rate to the last grade of primary education, both sexes (%)
2013,2012,2009,2008,2004,2002,2001,2000,1999,1995,1993,1987,1986,1985,1984,1982,1981,1980,1974,1973