33
/
AIzaSyB4mHJ5NPEv-XzF7P6NDYXjlkCWaeKw5bc
November 30, 2025
157993
Iran, Islamic Rep.
IRN
true
2
1
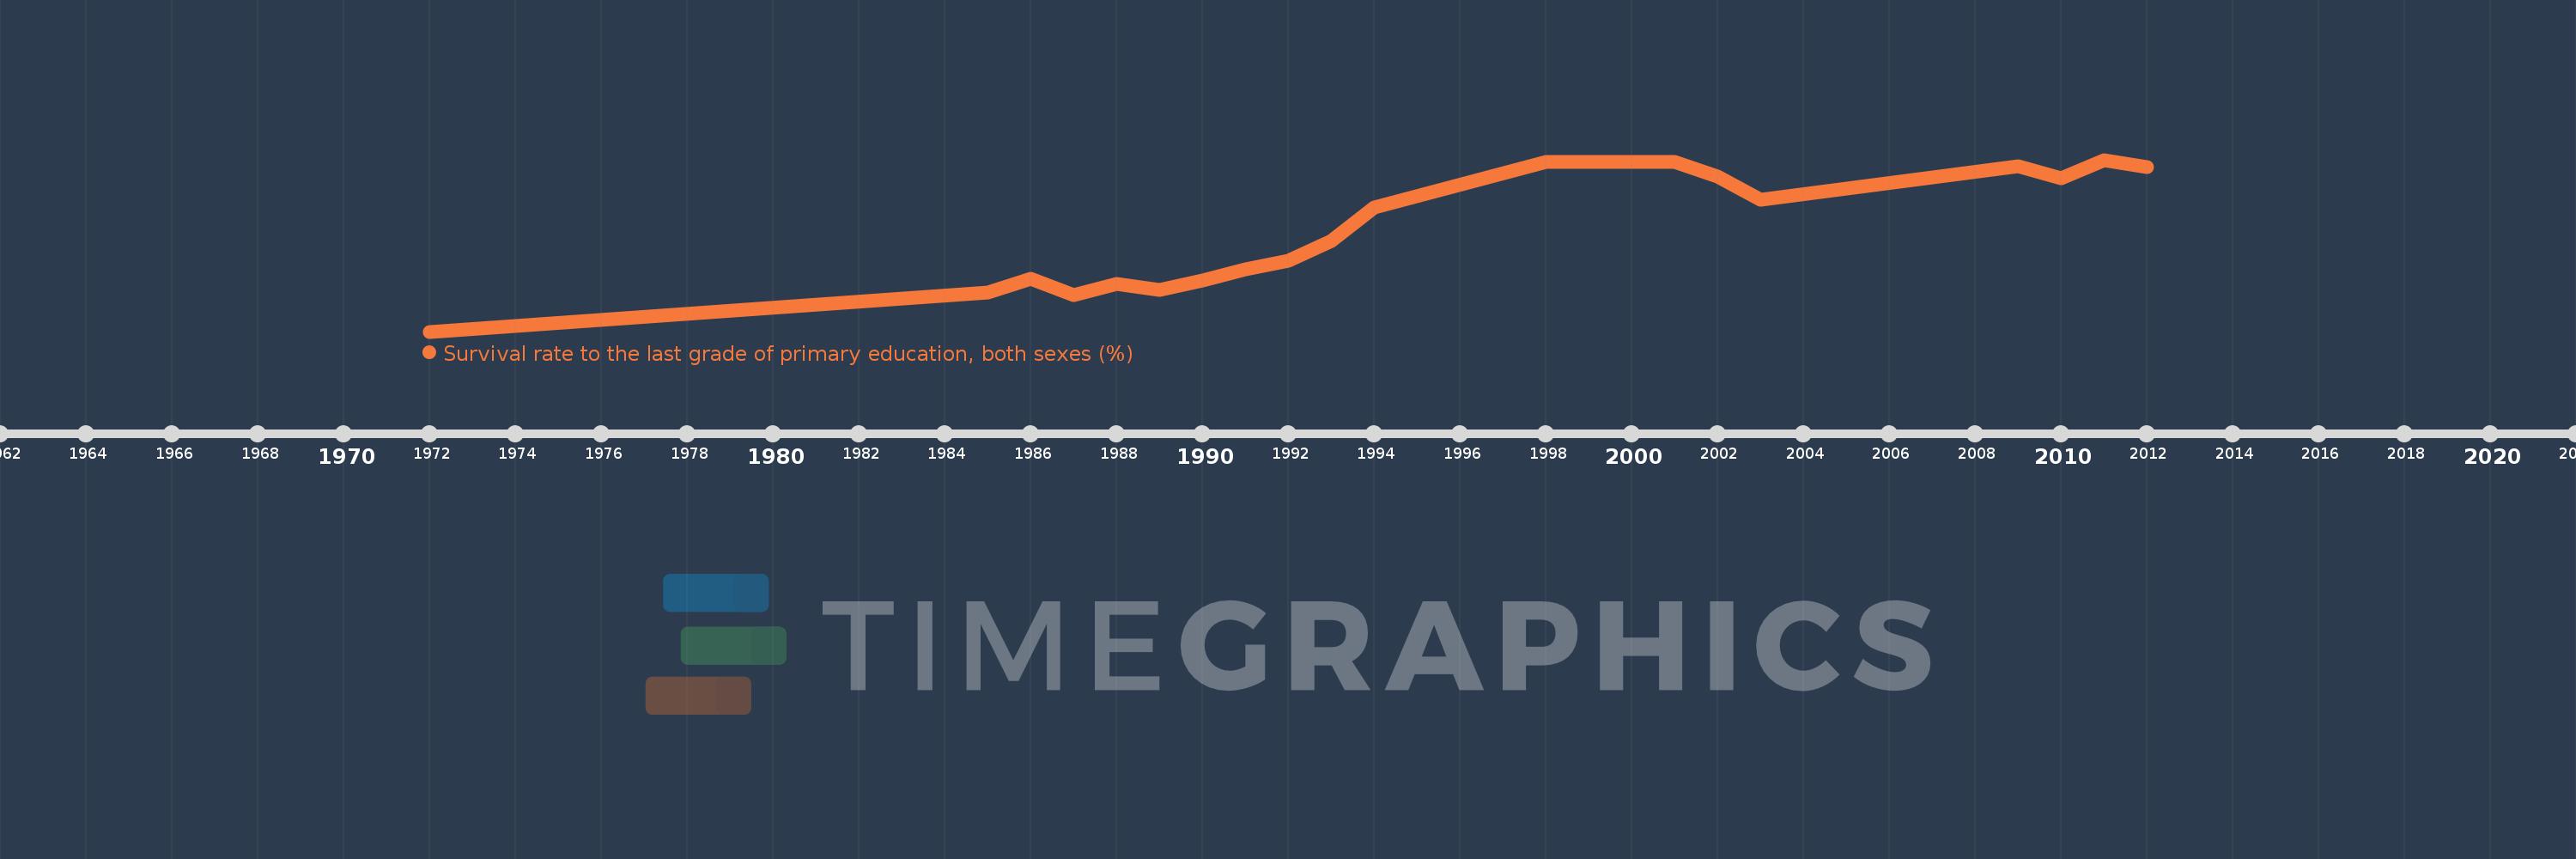
Survival rate to the last grade of primary education, both sexes (%)
2012,2011,2010,2009,2003,2002,2001,1998,1994,1993,1992,1991,1990,1989,1988,1987,1986,1985,1972