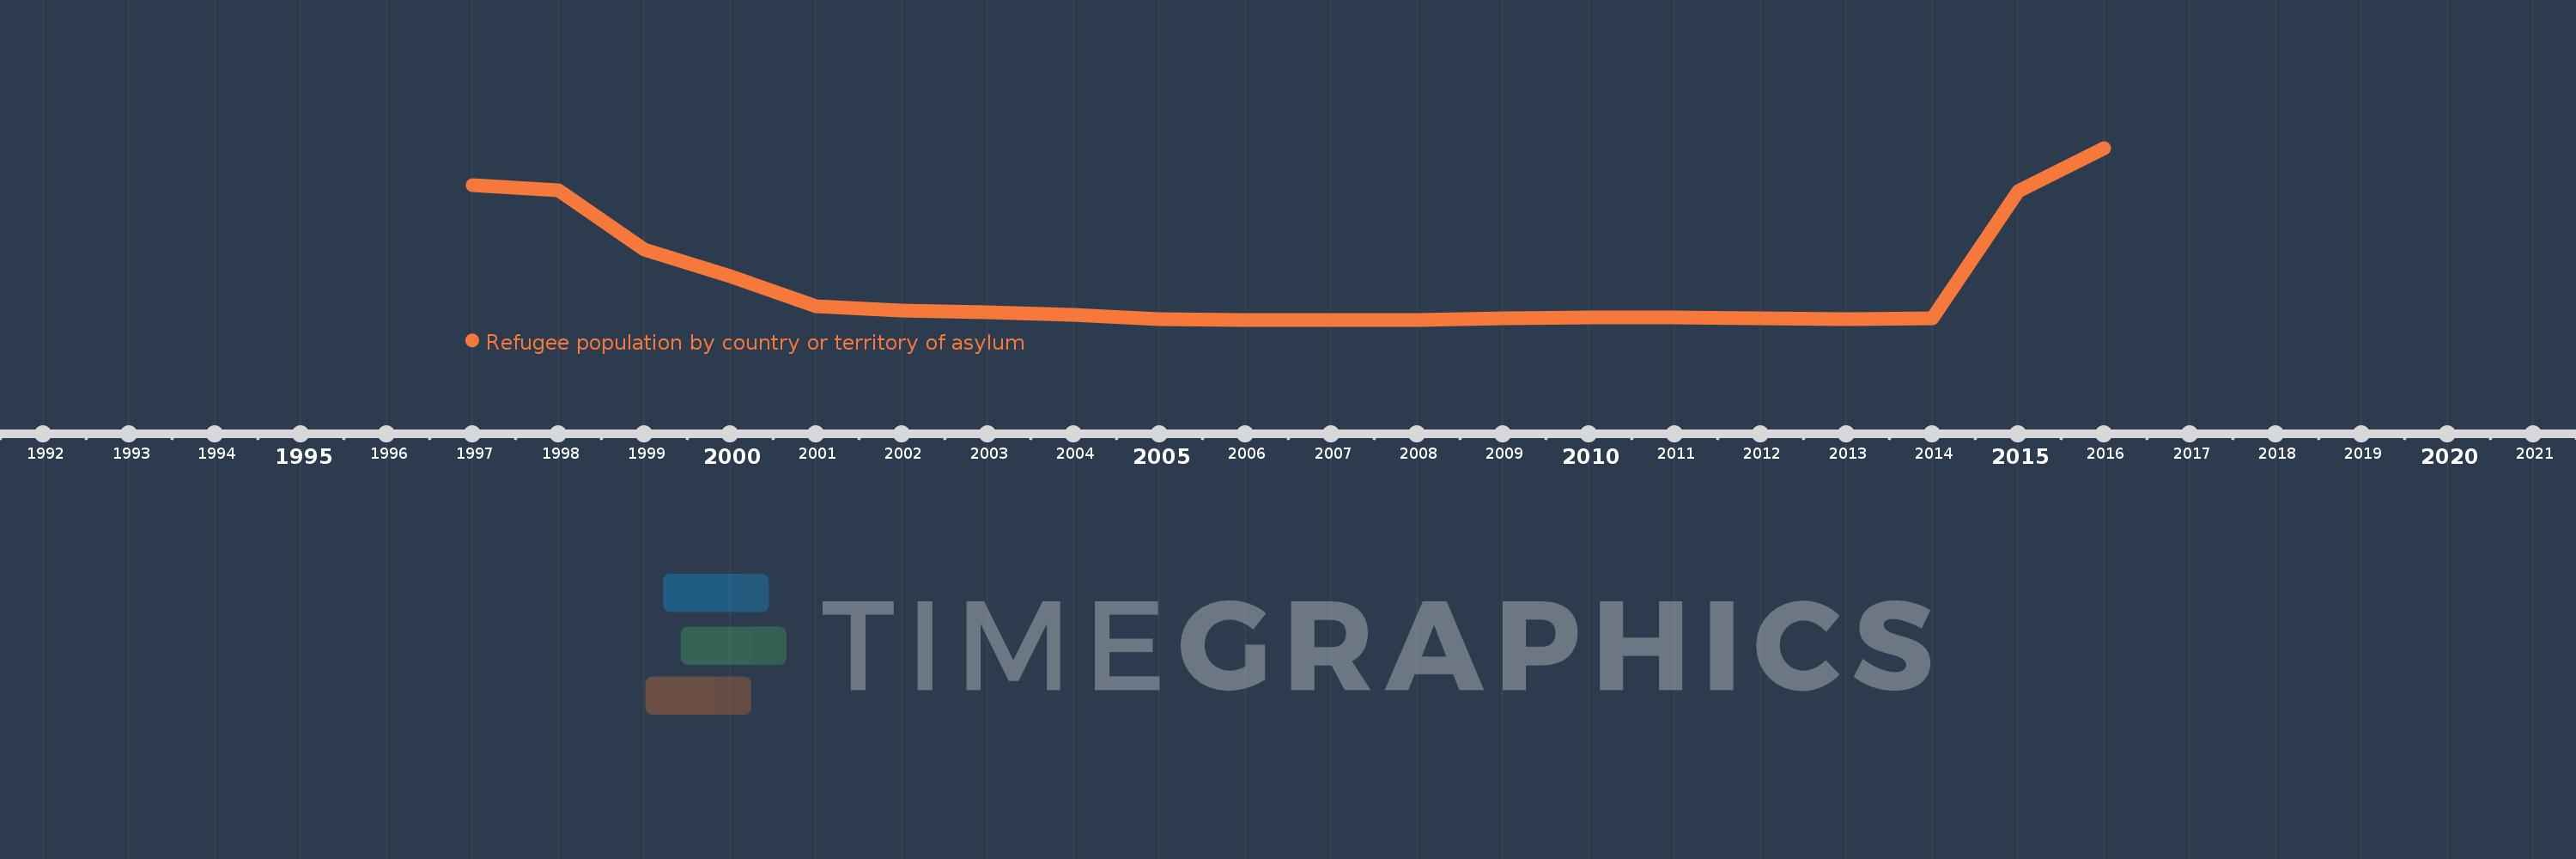
This timeline shows a graph from 1997 to 2016 of Russian Federation. No data until 1996. Number of actual observations by date: 20.
Source name:
World Development Indicators
Source organization:
United Nations High Commissioner for Refugees (UNHCR), Statistical Yearbook and data files, complemented by statistics on Palestinian refugees under the mandate of the UNRWA as published on its website. Data from UNHCR are available online at: www.unhcr.org/statistics/populationdatabase.
Categories, topics:
Health, Social Development
Last updated:
apr 23, 2017
Indicators value changes by year
Meaning:
67.135K
Minimum:
1.425K
jan 1, 2007
Maximum:
314.506K
jan 1, 2016
At the date of observation
Value
Absolute change
Change from the previous value
jan 1, 1997
246.691K
+246.691K
0.0%
jan 1, 1998
237.72K
-8.971K
-3.64%
jan 1, 1999
128.574K
-109.146K
-45.91%
jan 1, 2000
80.06K
-48.514K
-37.73%
jan 1, 2001
26.265K
-53.795K
-67.19%
jan 1, 2002
17.97K
-8.295K
-31.58%
jan 1, 2003
14.969K
-3.001K
-16.7%
jan 1, 2004
9.899K
-5.07K
-33.87%
jan 1, 2005
1.852K
-8.047K
-81.29%
jan 1, 2006
1.523K
-329.0
-17.76%
jan 1, 2007
1.425K
-98.0
-6.43%
jan 1, 2008
1.655K
+230.0
16.14%
jan 1, 2009
3.479K
+1.824K
110.21%
jan 1, 2010
4.88K
+1.401K
40.27%
jan 1, 2011
4.922K
+42.0
0.86%
jan 1, 2012
3.914K
-1.008K
-20.48%
jan 1, 2013
3.178K
-736.0
-18.8%
jan 1, 2014
3.458K
+280.0
8.81%
jan 1, 2015
235.75K
+232.292K
6.72K%
jan 1, 2016
314.506K
+78.756K
33.41%
Ranking of countries by current statistics by years