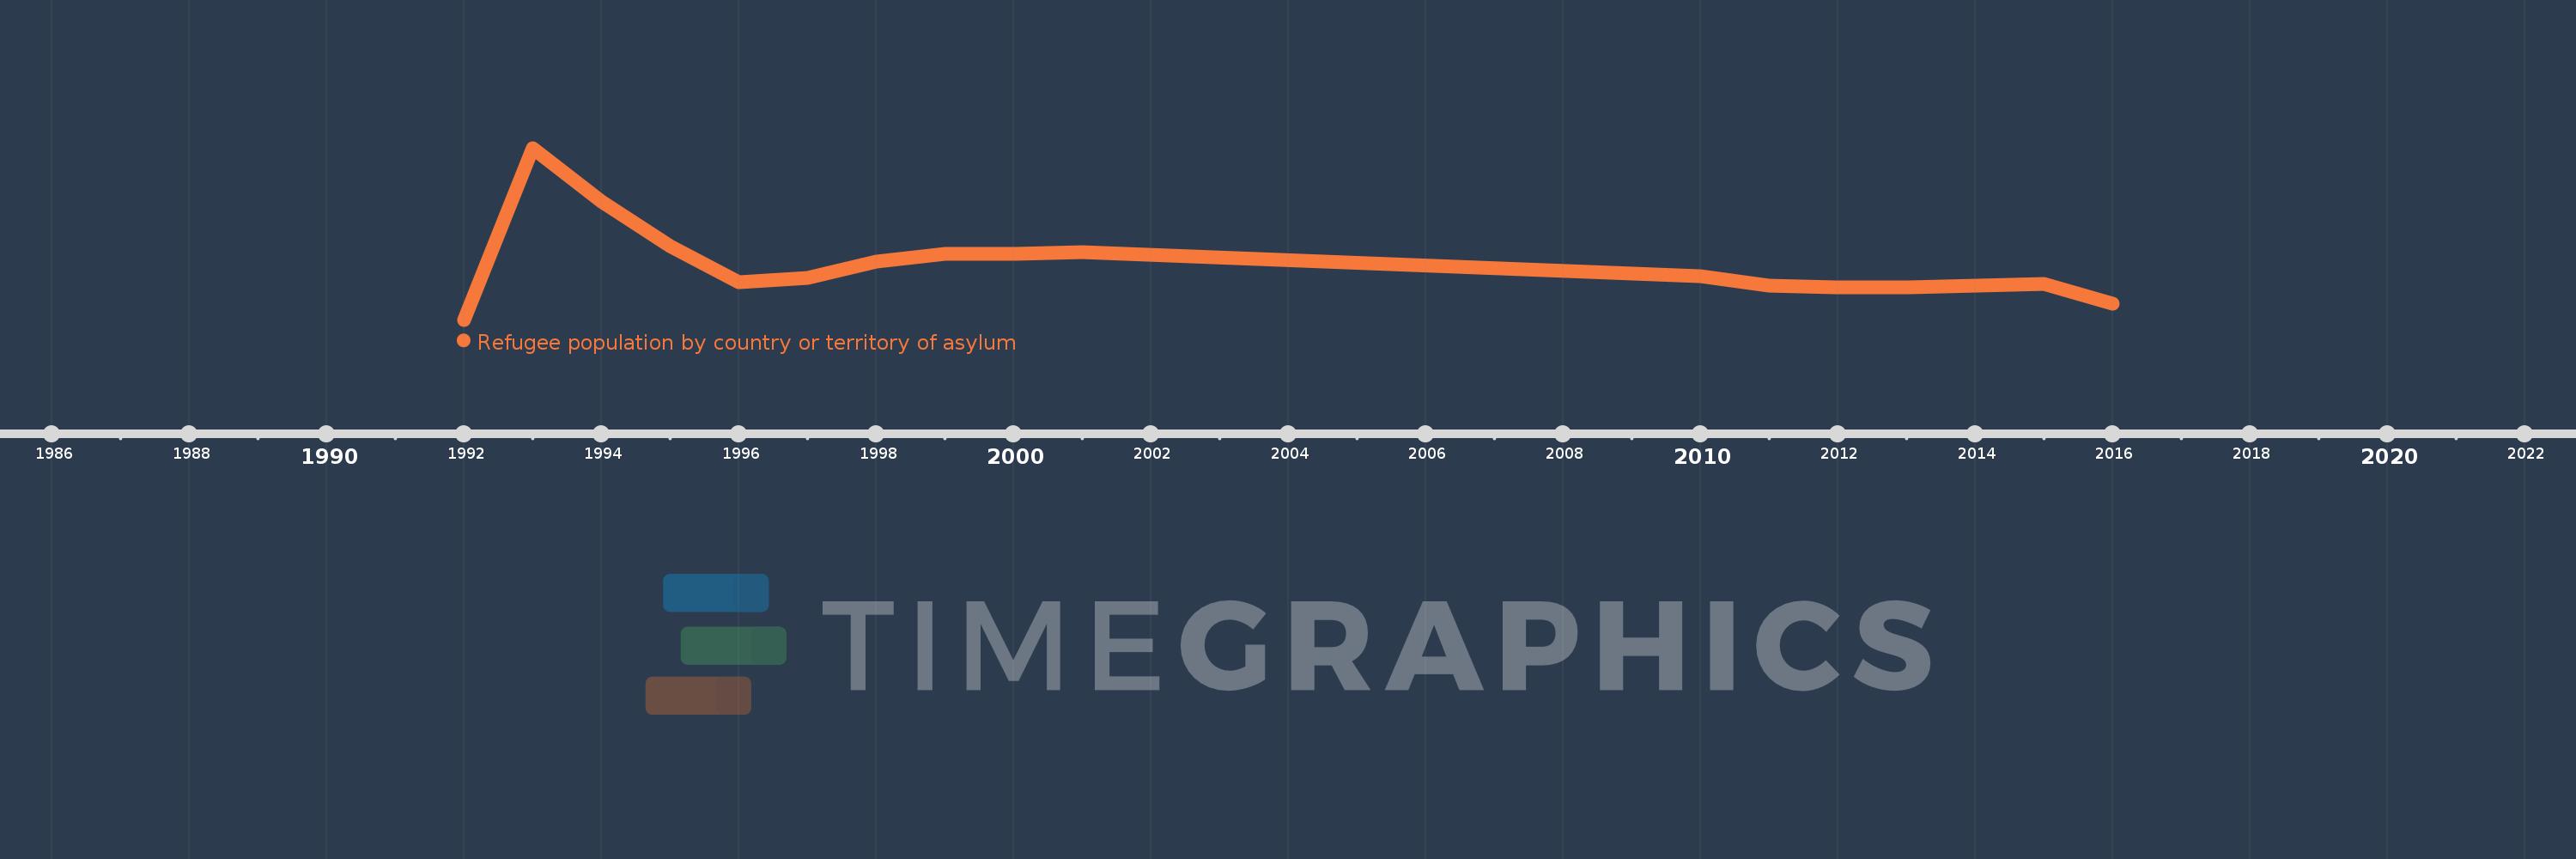
This timeline shows a graph from 1992 to 2016 of Jamaica. No data until 1991. Number of actual observations by date: 17.
Source name:
World Development Indicators
Source organization:
United Nations High Commissioner for Refugees (UNHCR), Statistical Yearbook and data files, complemented by statistics on Palestinian refugees under the mandate of the UNRWA as published on its website. Data from UNHCR are available online at: www.unhcr.org/statistics/populationdatabase.
Categories, topics:
Health, Social Development
Last updated:
apr 23, 2017
Indicators value changes by year
Meaning:
31.353
Minimum:
4.0
jan 1, 1992
Maximum:
90.0
jan 1, 1993
At the date of observation
Value
Absolute change
Change from the previous value
jan 1, 1992
4.0
+4.0
0.0%
jan 1, 1993
90.0
+86.0
2.15K%
jan 1, 1994
63.0
-27.0
-30.0%
jan 1, 1995
41.0
-22.0
-34.92%
jan 1, 1996
23.0
-18.0
-43.9%
jan 1, 1997
25.0
+2.0
8.7%
jan 1, 1998
33.0
+8.0
32.0%
jan 1, 1999
37.0
+4.0
12.12%
jan 1, 2000
37.0
0.0
0.0%
jan 1, 2001
38.0
+1.0
2.7%
jan 1, 2010
26.0
-12.0
-31.58%
jan 1, 2011
21.0
-5.0
-19.23%
jan 1, 2012
20.0
-1.0
-4.76%
jan 1, 2013
20.0
0.0
0.0%
jan 1, 2014
21.0
+1.0
5.0%
jan 1, 2015
22.0
+1.0
4.76%
jan 1, 2016
12.0
-10.0
-45.45%
Ranking of countries by current statistics by years