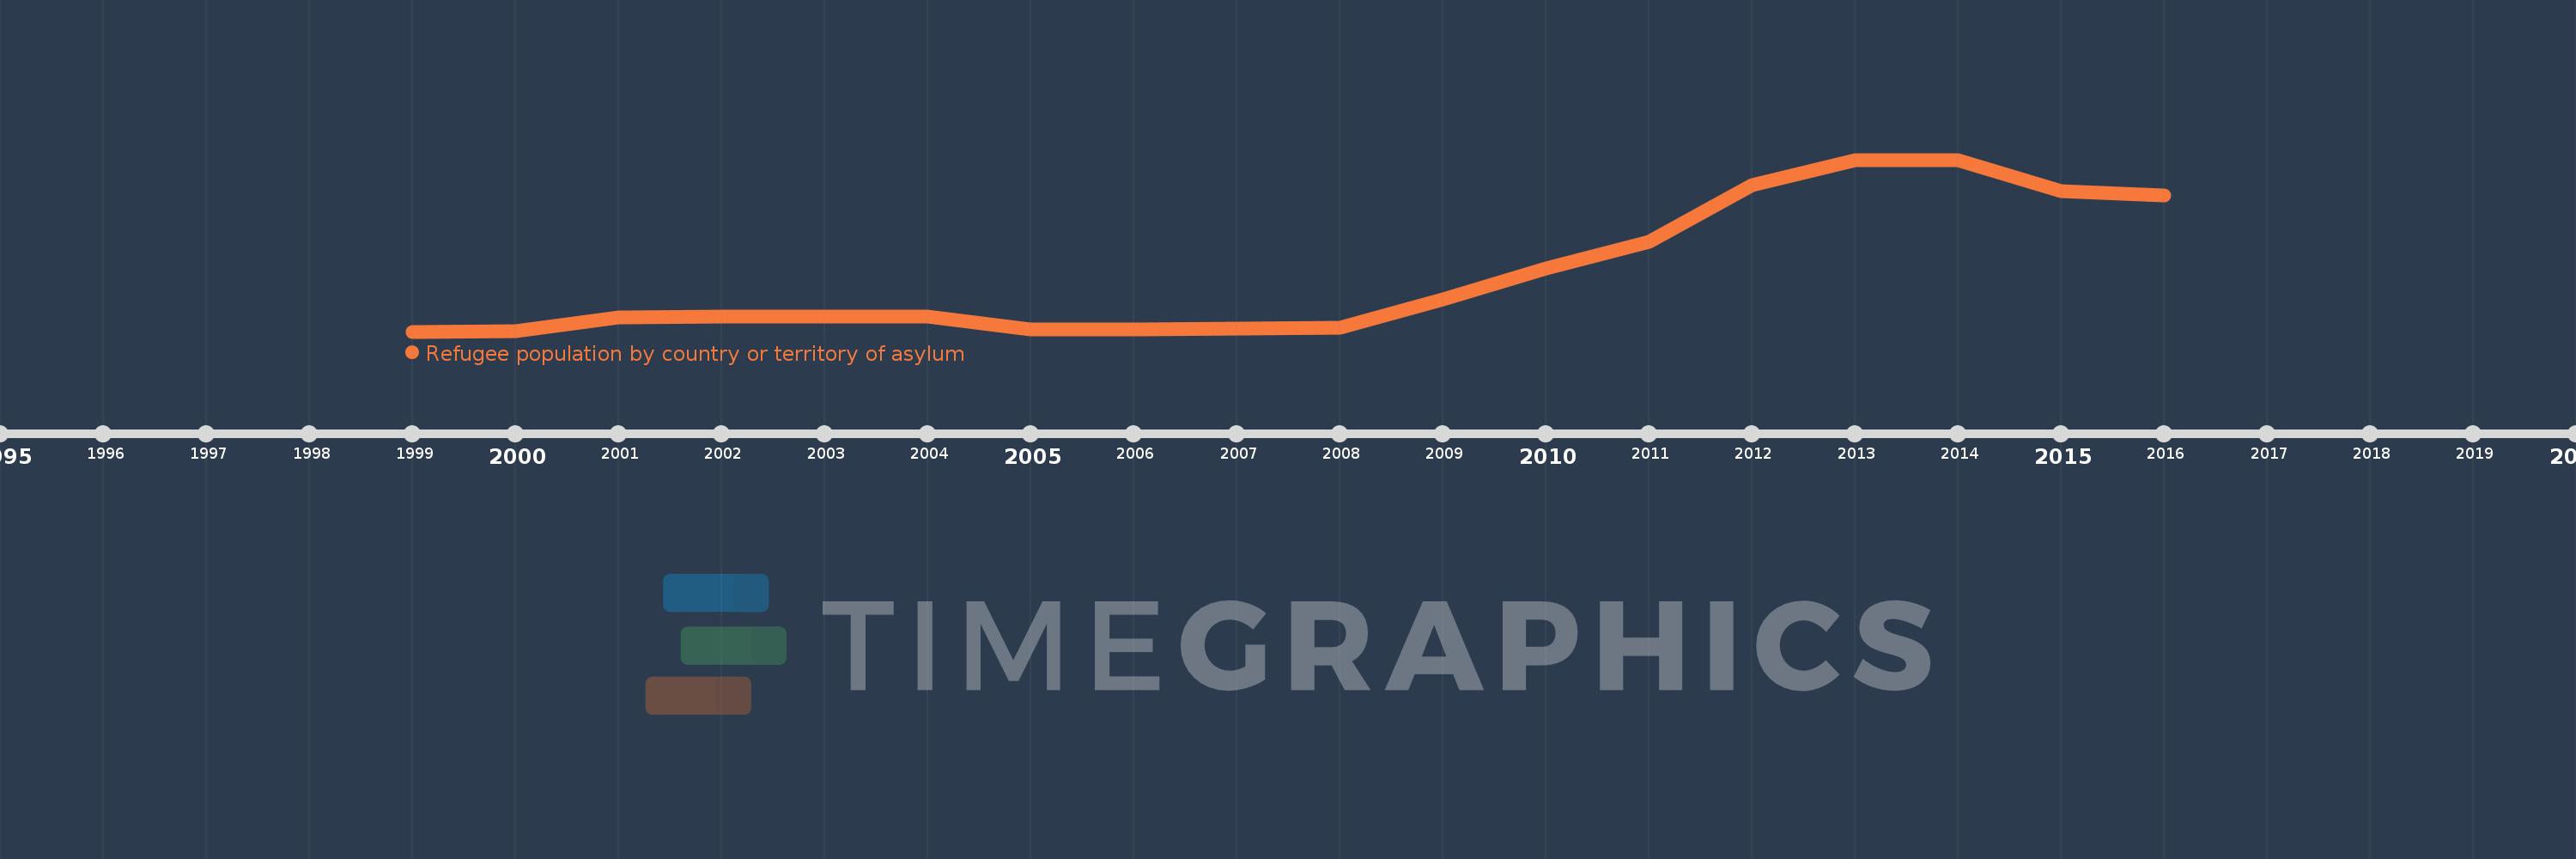
This timeline shows a graph from 1999 to 2016 of Israel. No data until 1998. Number of actual observations by date: 18.
Source name:
World Development Indicators
Source organization:
United Nations High Commissioner for Refugees (UNHCR), Statistical Yearbook and data files, complemented by statistics on Palestinian refugees under the mandate of the UNRWA as published on its website. Data from UNHCR are available online at: www.unhcr.org/statistics/populationdatabase.
Categories, topics:
Health, Social Development
Last updated:
apr 23, 2017
Indicators value changes by year
Meaning:
16.031K
Minimum:
27.0
jan 1, 1999
Maximum:
48.505K
jan 1, 2013
At the date of observation
Value
Absolute change
Change from the previous value
jan 1, 1999
27.0
+27.0
0.0%
jan 1, 2000
128.0
+101.0
374.07%
jan 1, 2001
4.075K
+3.947K
3.08K%
jan 1, 2002
4.168K
+93.0
2.28%
jan 1, 2003
4.179K
+11.0
0.26%
jan 1, 2004
4.179K
0.0
0.0%
jan 1, 2005
574.0
-3.605K
-86.26%
jan 1, 2006
609.0
+35.0
6.1%
jan 1, 2007
837.0
+228.0
37.44%
jan 1, 2008
1.156K
+319.0
38.11%
jan 1, 2009
9.137K
+7.981K
690.4%
jan 1, 2010
17.736K
+8.599K
94.11%
jan 1, 2011
25.471K
+7.735K
43.61%
jan 1, 2012
41.235K
+15.764K
61.89%
jan 1, 2013
48.505K
+7.27K
17.63%
jan 1, 2014
48.325K
-180.0
-0.37%
jan 1, 2015
39.716K
-8.609K
-17.81%
jan 1, 2016
38.5K
-1.216K
-3.06%
Ranking of countries by current statistics by years