Download This statistics in other country:
Timeline:
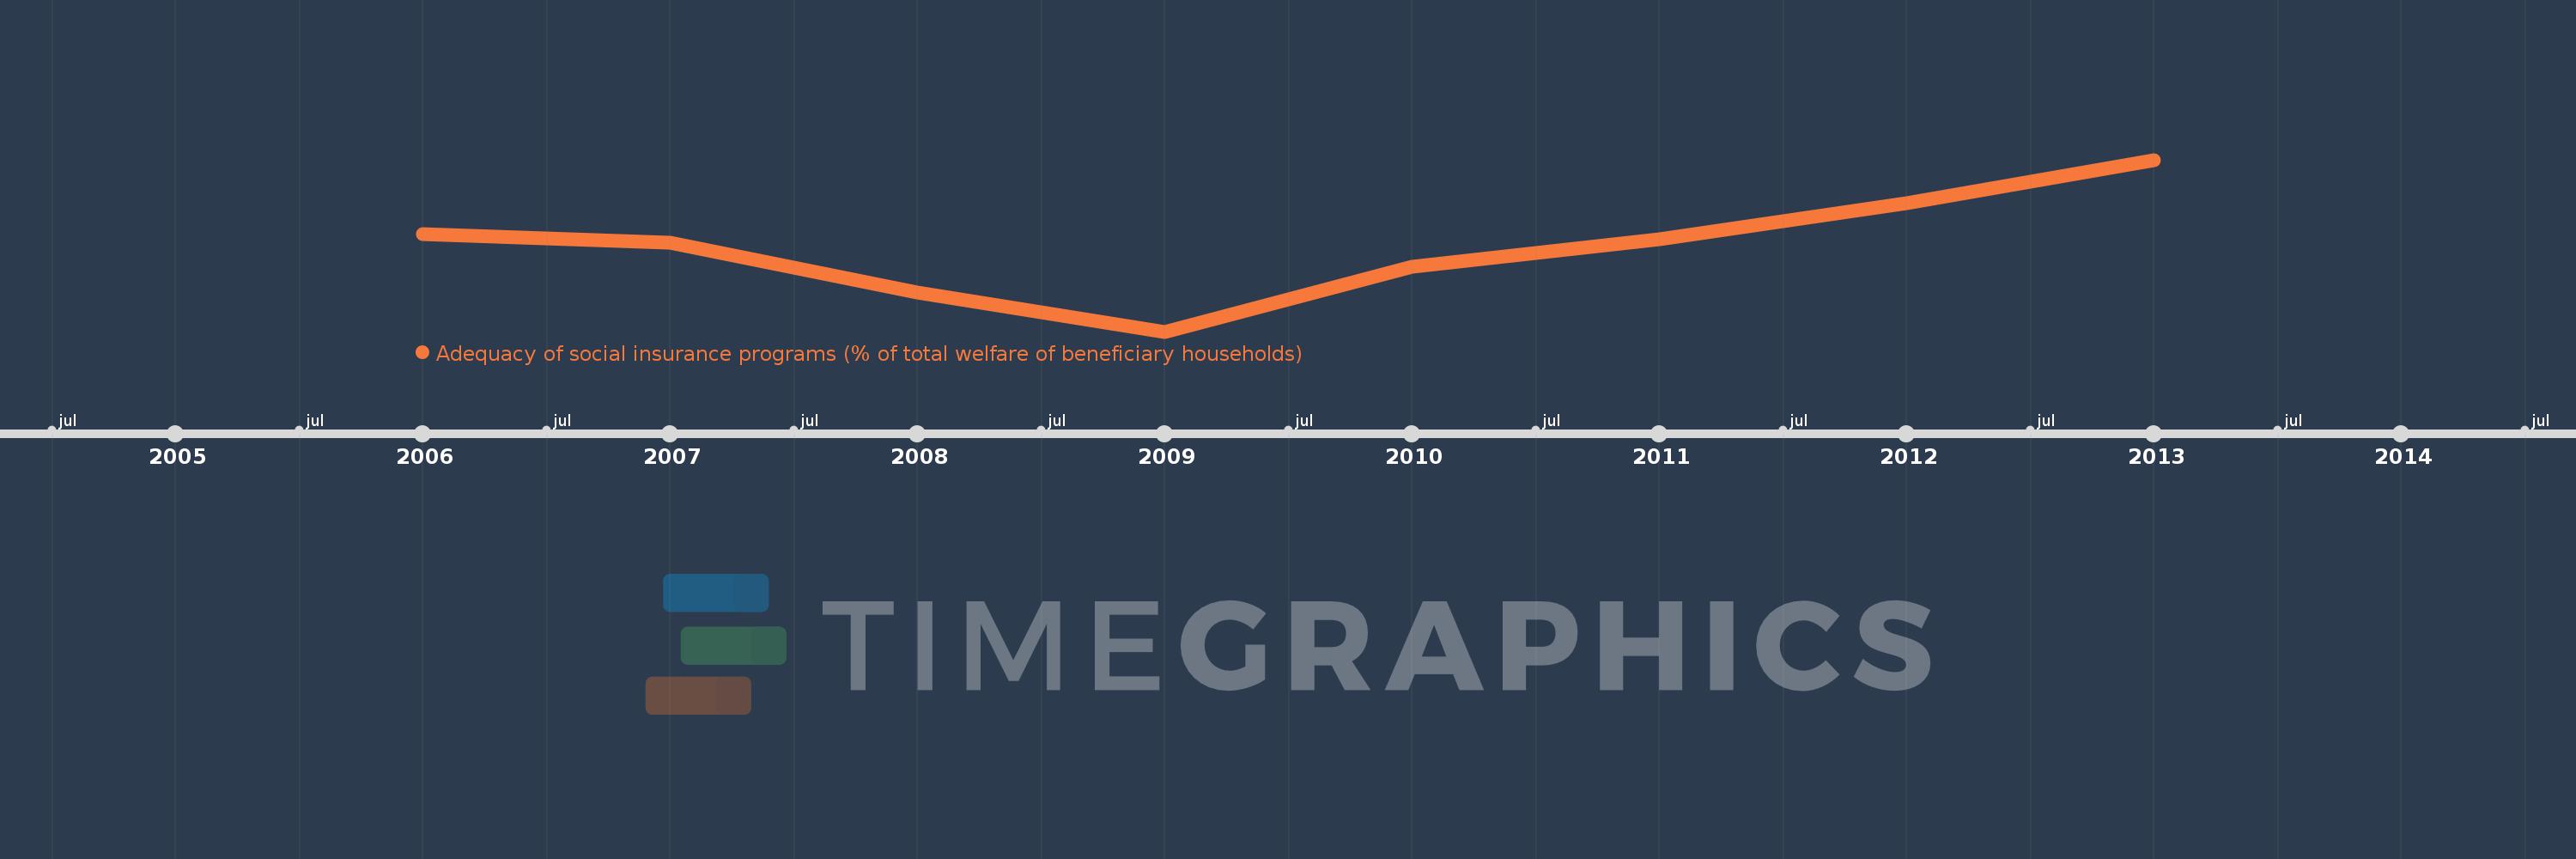
This timeline shows a graph from 2006 to 2013 of Poland. No data until 2005. Number of actual observations by date: 8.
Source name:
World Development Indicators
Source organization:
The Atlas of Social Protection: Indicators of Resilience and Equity (ASPIRE)
Categories, topics:
Social Protection & Labor
Last updated:
apr 23, 2017
Indicators value changes by year
Minimum:
68.412
jan 1, 2009
Maximum:
74.276
jan 1, 2013
At the date of observation
Value
Absolute change
Change from the previous value
jan 1, 2006
71.754
+71.754
0.0%
jan 1, 2007
71.458
-0.296
-0.41%
jan 1, 2008
69.743
-1.715
-2.4%
jan 1, 2009
68.412
-1.331
-1.91%
jan 1, 2010
70.626
+2.215
3.24%
jan 1, 2011
71.556
+0.929
1.32%
jan 1, 2012
72.796
+1.24
1.73%
jan 1, 2013
74.276
+1.48
2.03%
Ranking of countries by current statistics by years