Download This statistics in other country:
Timeline:
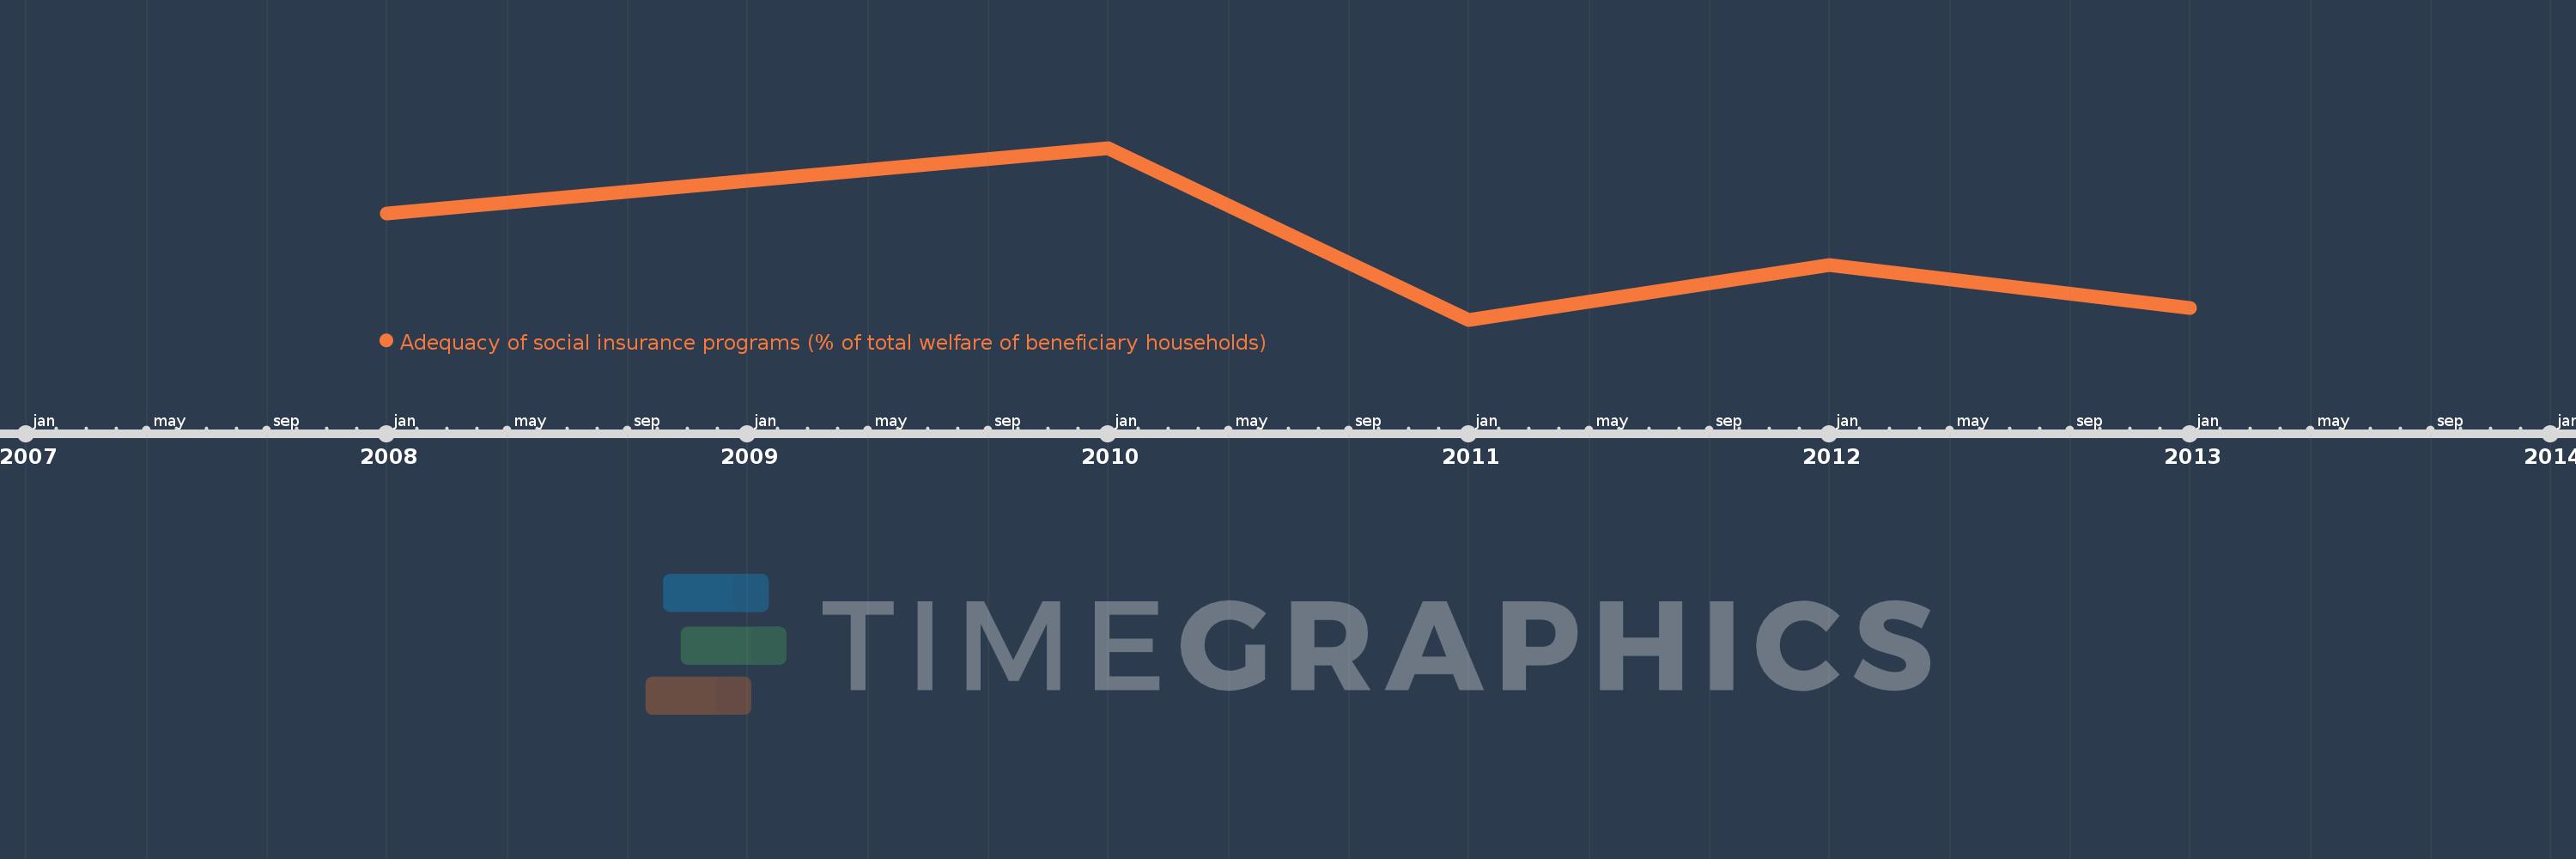
This timeline shows a graph from 2008 to 2013 of Mongolia. No data until 2007. Number of actual observations by date: 5.
Source name:
World Development Indicators
Source organization:
The Atlas of Social Protection: Indicators of Resilience and Equity (ASPIRE)
Categories, topics:
Social Protection & Labor
Last updated:
apr 23, 2017
Indicators value changes by year
Minimum:
22.969
jan 1, 2011
Maximum:
29.191
jan 1, 2010
At the date of observation
Value
Absolute change
Change from the previous value
jan 1, 2008
26.807
+26.807
0.0%
jan 1, 2010
29.191
+2.384
8.89%
jan 1, 2011
22.969
-6.222
-21.31%
jan 1, 2012
24.941
+1.972
8.58%
jan 1, 2013
23.4
-1.541
-6.18%
Ranking of countries by current statistics by years