Download This statistics in other country:
Timeline:
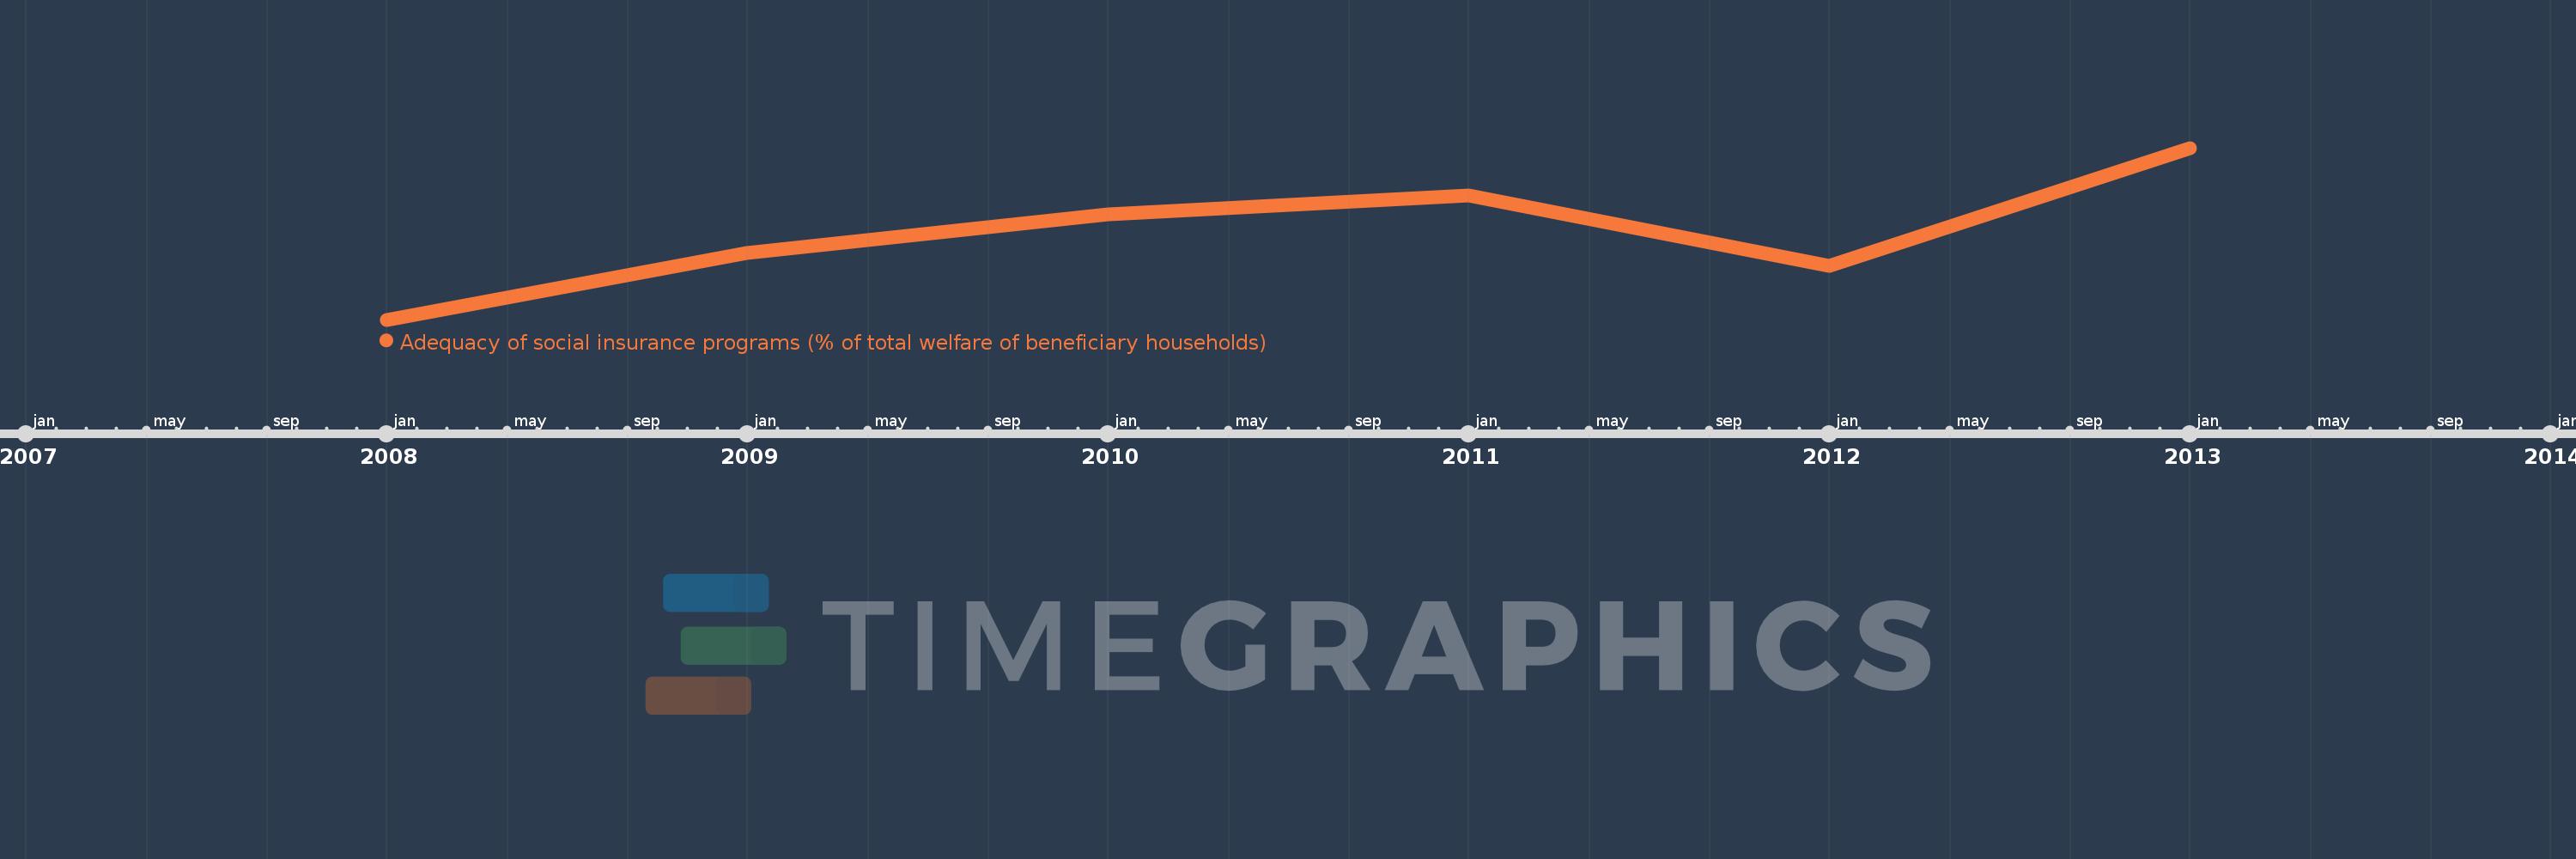
This timeline shows a graph from 2008 to 2013 of El Salvador. No data until 2007. Number of actual observations by date: 6.
Source name:
World Development Indicators
Source organization:
The Atlas of Social Protection: Indicators of Resilience and Equity (ASPIRE)
Categories, topics:
Social Protection & Labor
Last updated:
apr 23, 2017
Indicators value changes by year
Minimum:
28.676
jan 1, 2008
At the date of observation
Value
Absolute change
Change from the previous value
jan 1, 2008
28.676
+28.676
0.0%
jan 1, 2009
30.613
+1.936
6.75%
jan 1, 2010
31.732
+1.119
3.66%
jan 1, 2011
32.286
+0.554
1.75%
jan 1, 2012
30.248
-2.038
-6.31%
jan 1, 2013
33.66
+3.412
11.28%
Ranking of countries by current statistics by years