Download This statistics in other country:
Timeline:
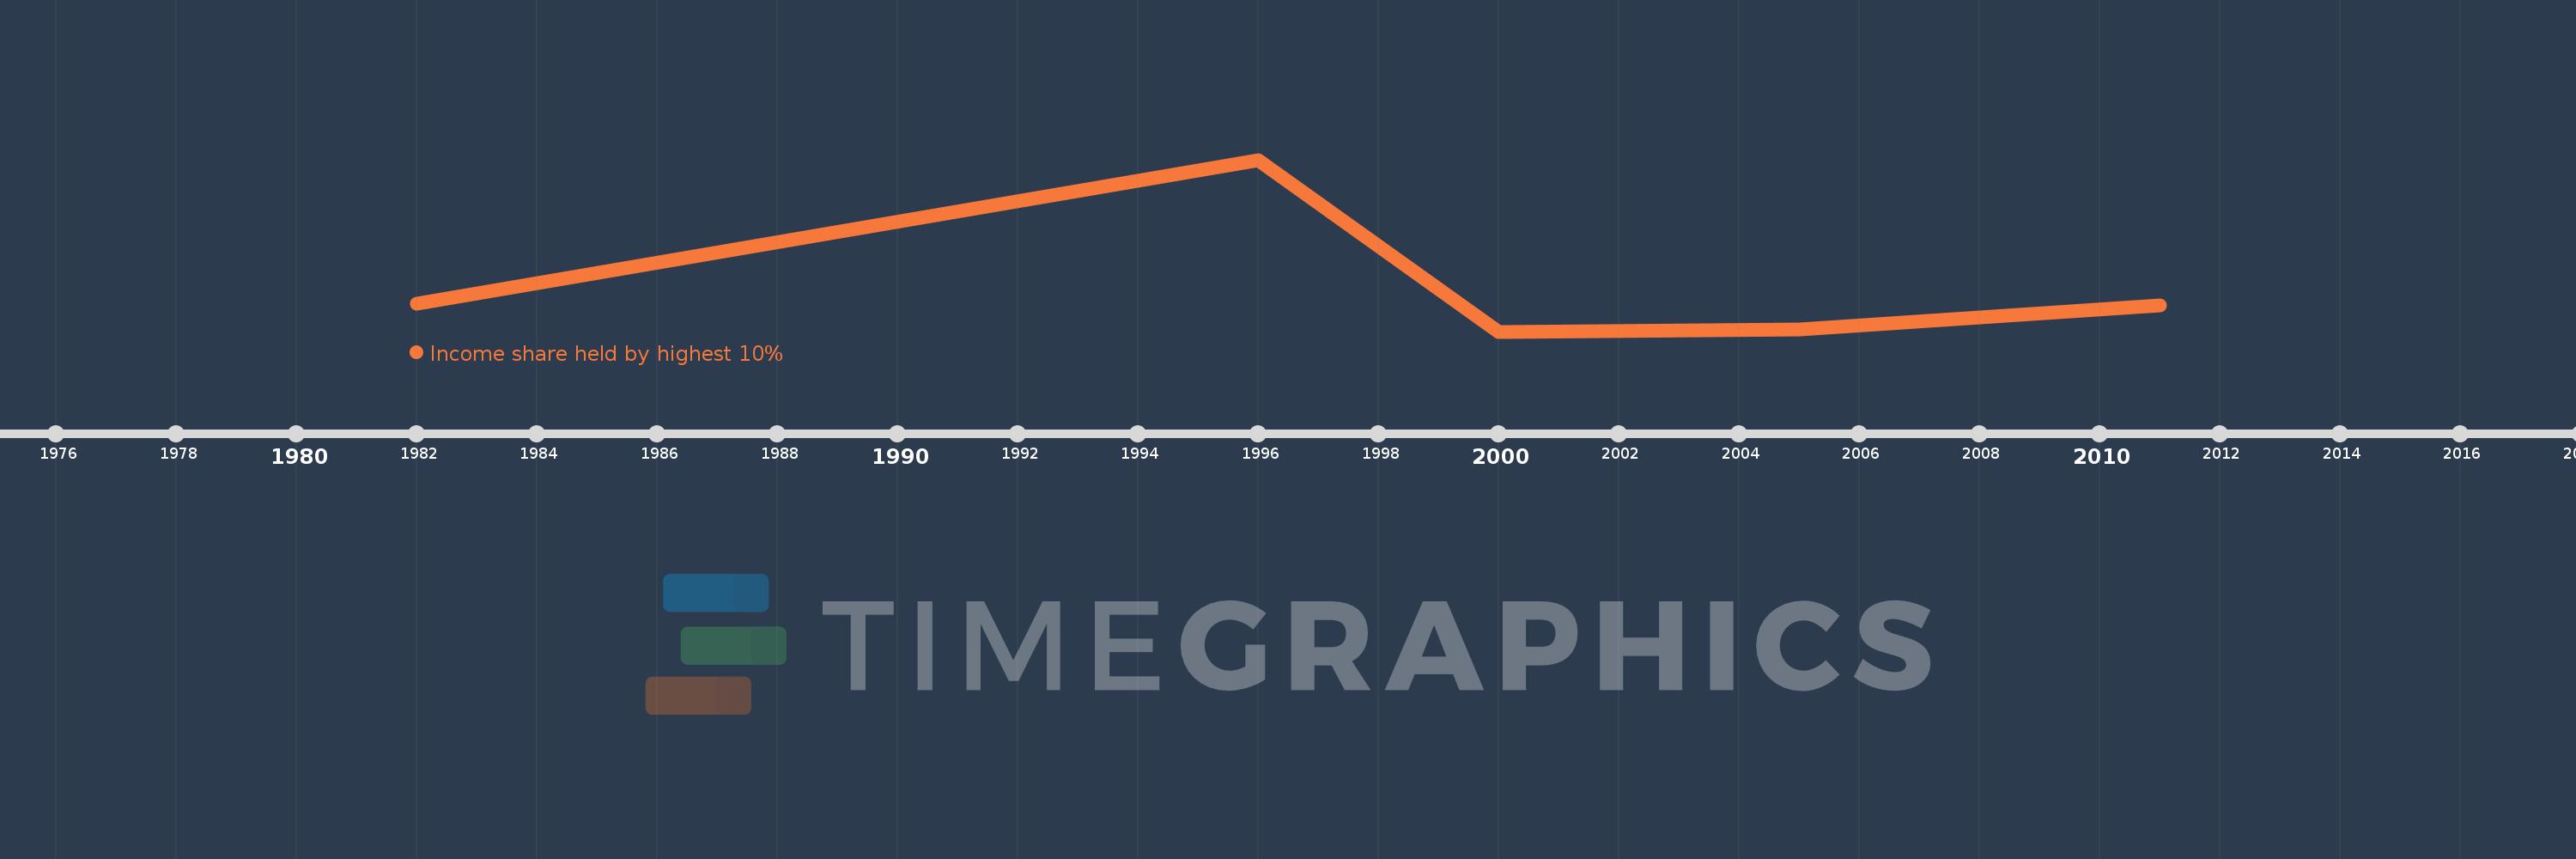
This timeline shows a graph from 1982 to 2011 of Ethiopia. No data until 1981. Number of actual observations by date: 5.
Source name:
World Development Indicators
Source organization:
World Bank, Development Research Group. Data are based on primary household survey data obtained from government statistical agencies and World Bank country departments. Data for high-income economies are from the Luxembourg Income Study database. For more information and methodology, please see PovcalNet (http://iresearch.worldbank.org/PovcalNet/index.htm).
Categories, topics:
Poverty
Last updated:
apr 23, 2017
Indicators value changes by year
At the date of observation
Value
Absolute change
Change from the previous value
jan 1, 1982
27.52
+27.52
0.0%
jan 1, 1996
38.05
+10.53
38.26%
jan 1, 2000
25.48
-12.57
-33.04%
jan 1, 2005
25.64
+0.16
0.63%
jan 1, 2011
27.4
+1.76
6.86%
Ranking of countries by current statistics by years