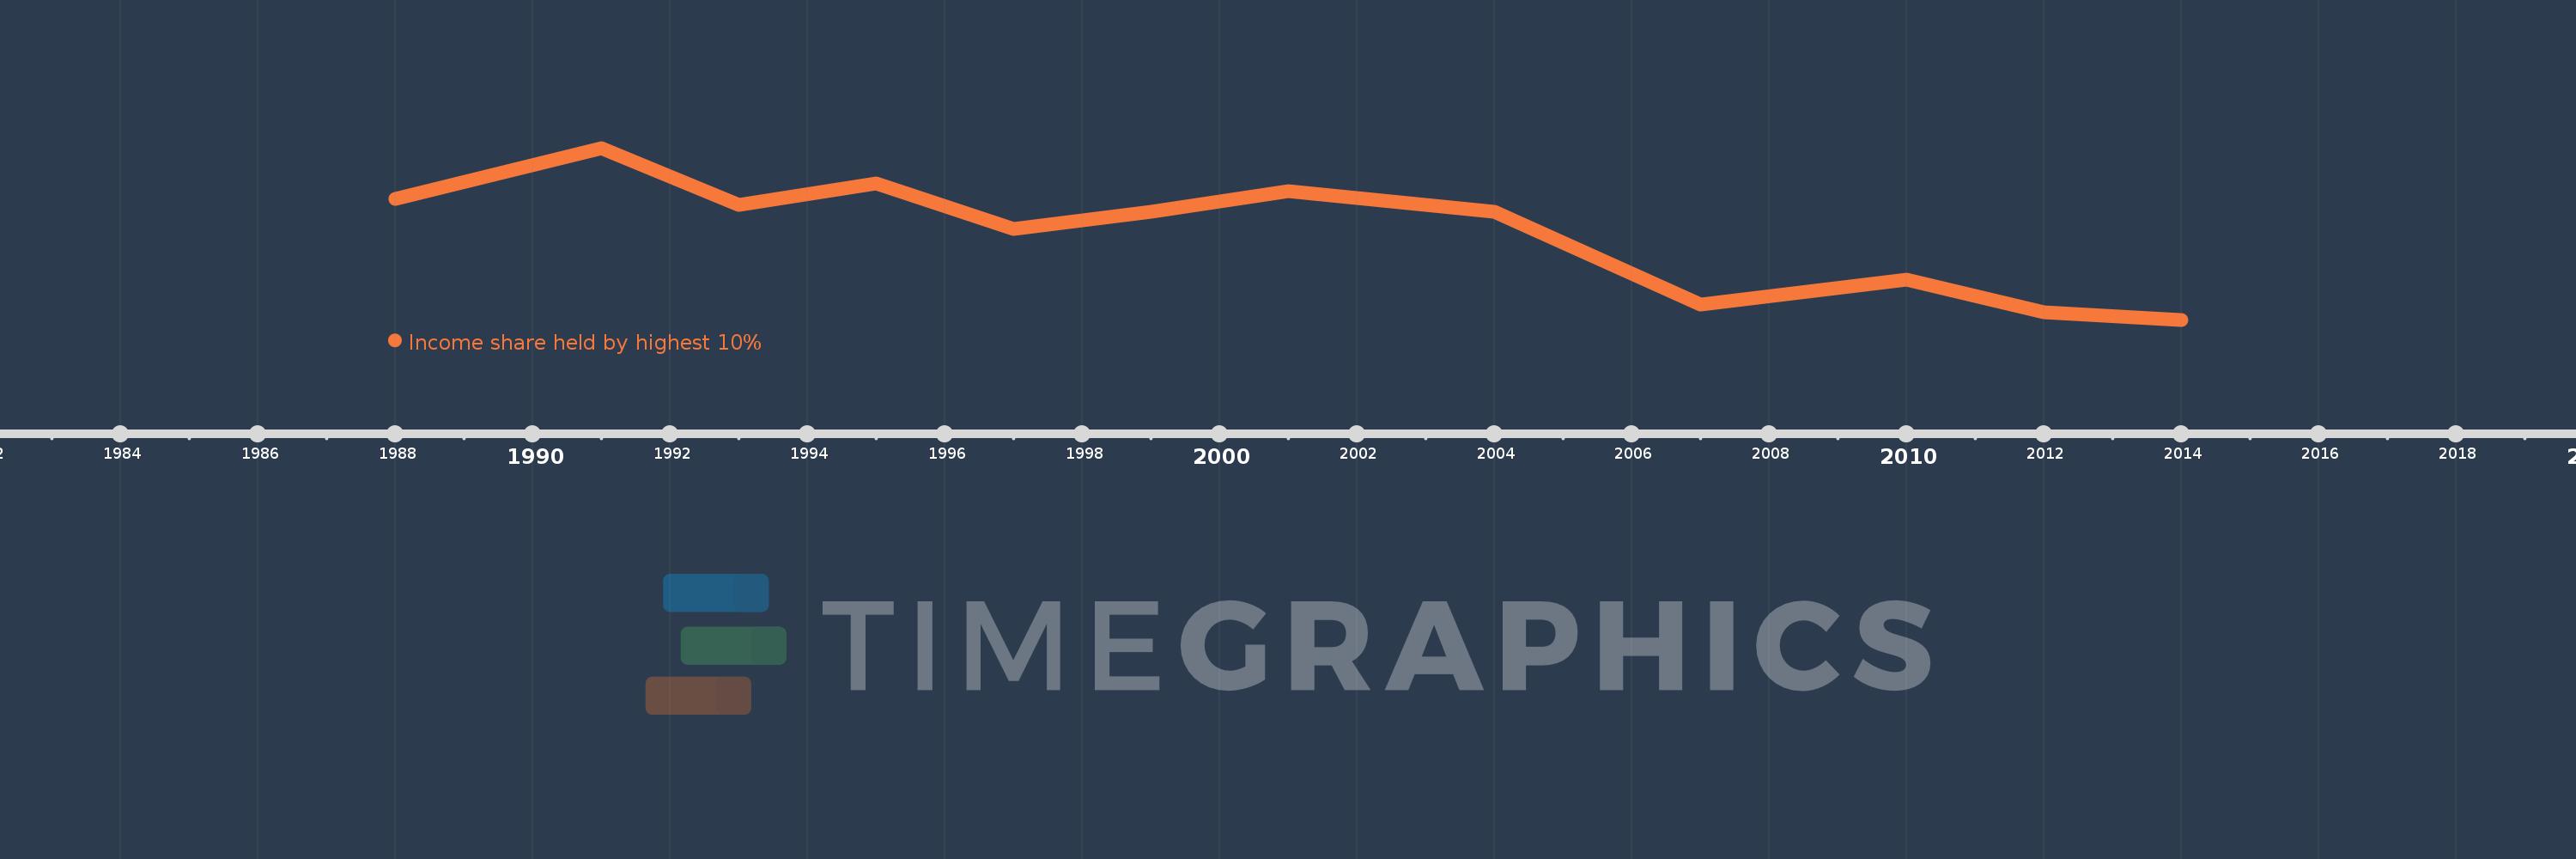
This timeline shows a graph from 1988 to 2014 of Chile. No data until 1987. Number of actual observations by date: 12.
Source name:
World Development Indicators
Source organization:
World Bank, Development Research Group. Data are based on primary household survey data obtained from government statistical agencies and World Bank country departments. Data for high-income economies are from the Luxembourg Income Study database. For more information and methodology, please see PovcalNet (http://iresearch.worldbank.org/PovcalNet/index.htm).
Categories, topics:
Poverty
Last updated:
apr 23, 2017
Indicators value changes by year
Meaning:
44.289
Minimum:
41.47
jan 1, 2014
Maximum:
47.05
jan 1, 1991
At the date of observation
Value
Absolute change
Change from the previous value
jan 1, 1988
45.39
+45.39
0.0%
jan 1, 1991
47.05
+1.66
3.66%
jan 1, 1993
45.2
-1.85
-3.93%
jan 1, 1995
45.91
+0.71
1.57%
jan 1, 1997
44.43
-1.48
-3.22%
jan 1, 1999
44.97
+0.54
1.22%
jan 1, 2001
45.64
+0.67
1.49%
jan 1, 2004
44.97
-0.67
-1.47%
jan 1, 2007
41.96
-3.01
-6.69%
jan 1, 2010
42.76
+0.8
1.91%
jan 1, 2012
41.72
-1.04
-2.43%
jan 1, 2014
41.47
-0.25
-0.6%
Ranking of countries by current statistics by years