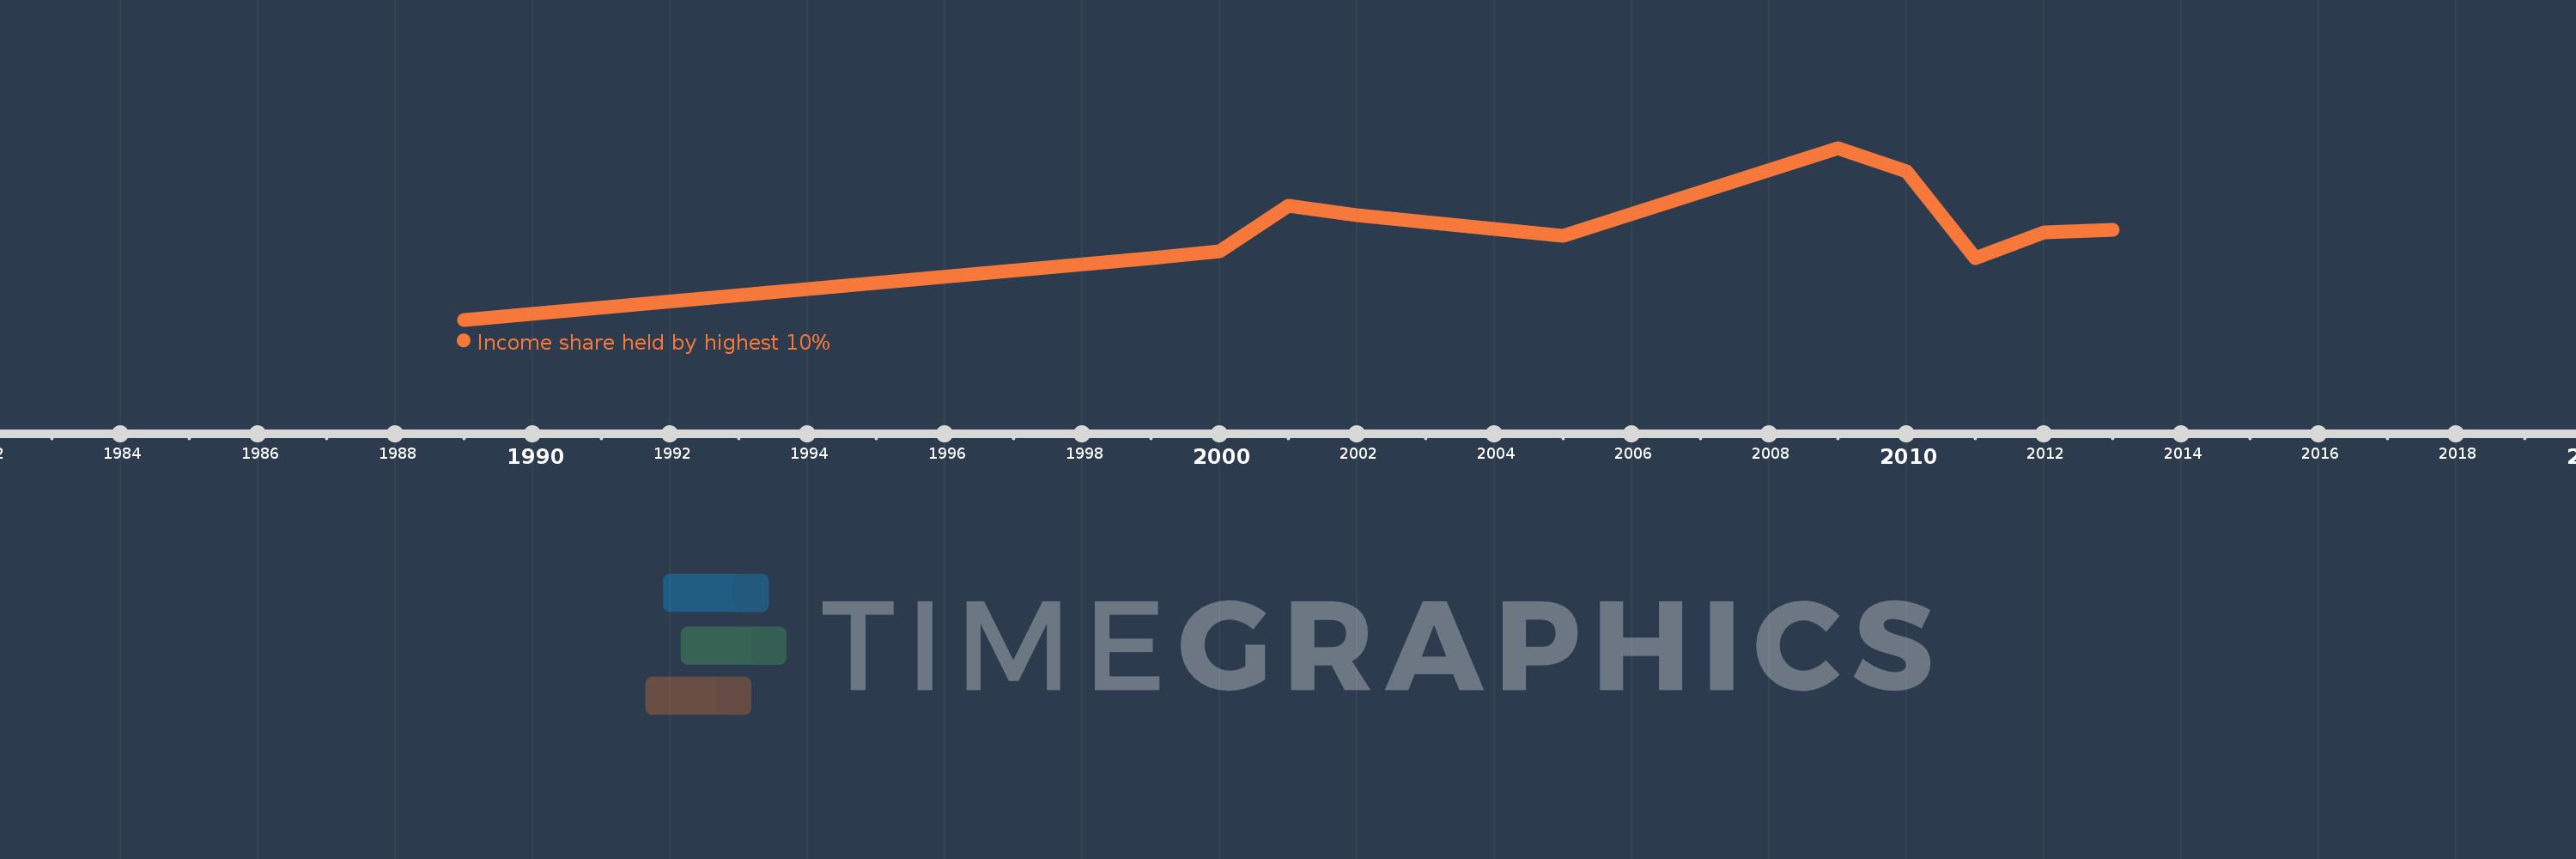
This timeline shows a graph from 1989 to 2013 of Croatia. No data until 1988. Number of actual observations by date: 11.
Source name:
World Development Indicators
Source organization:
World Bank, Development Research Group. Data are based on primary household survey data obtained from government statistical agencies and World Bank country departments. Data for high-income economies are from the Luxembourg Income Study database. For more information and methodology, please see PovcalNet (http://iresearch.worldbank.org/PovcalNet/index.htm).
Categories, topics:
Poverty
Last updated:
apr 23, 2017
Indicators value changes by year
Meaning:
23.888
Minimum:
19.49
jan 1, 1989
Maximum:
27.88
jan 1, 2009
At the date of observation
Value
Absolute change
Change from the previous value
jan 1, 1989
19.49
+19.49
0.0%
jan 1, 1999
22.48
+2.99
15.34%
jan 1, 2000
22.84
+0.36
1.6%
jan 1, 2001
25.06
+2.22
9.72%
jan 1, 2002
24.59
-0.47
-1.88%
jan 1, 2005
23.59
-1.0
-4.07%
jan 1, 2009
27.88
+4.29
18.19%
jan 1, 2010
26.74
-1.14
-4.09%
jan 1, 2011
22.49
-4.25
-15.89%
jan 1, 2012
23.74
+1.25
5.56%
jan 1, 2013
23.87
+0.13
0.55%
Ranking of countries by current statistics by years