29
/pt/
pt
AIzaSyAYiBZKx7MnpbEhh9jyipgxe19OcubqV5w
April 1, 2024
59242
Sub-Saharan Africa
SSF
false
2
1
Percentage of female teachers in primary education who are trained, female (%)
2015,2014,2013,2012,2011,2010,2009,2008,2007,2006,2005,2004,2003,2002
Download
Biblioteca de estatísticas globais →Sub-Saharan Africa  →

Percentage of female teachers in primary education who are trained, female (%)

Estas estatísticas em outros países:
AlgeriaAndorraAngolaAntigua and BarbudaArab WorldArmeniaArubaAzerbaijanBahamas, TheBahrainBangladeshBarbadosBelarusBelizeBeninBermudaBhutanBoliviaBotswanaBritish Virgin IslandsBrunei DarussalamBurkina FasoBurundiCabo VerdeCambodiaCameroonCaribbean small statesCayman IslandsCentral African RepublicColombiaComorosCongo, Dem. Rep.Congo, Rep.Costa RicaCote d'IvoireCroatiaCubaDjiboutiDominicaDominican RepublicEcuadorEgypt, Arab Rep.El SalvadorEquatorial GuineaEritreaEthiopiaFijiFragile and conflict affected situationsGabonGambia, TheGeorgiaGhanaGibraltarGrenadaGuineaGuinea-BissauGuyanaHeavily indebted poor countries (HIPC)HondurasHong Kong SAR, ChinaIDA blendIDA onlyIDA totalIran, Islamic Rep.IraqJamaicaKazakhstanKenyaKiribatiKuwaitKyrgyz RepublicLao PDRLeast developed countries: UN classificationLebanonLesothoLiberiaLow incomeMacao SAR, ChinaMadagascarMalawiMalaysiaMaldivesMaliMauritaniaMauritiusMiddle East & North AfricaMiddle East & North Africa (excluding high income)Middle East & North Africa (IDA & IBRD countries)MoldovaMongoliaMoroccoMozambiqueMyanmarNamibiaNauruNepalNicaraguaNigerNigeriaOmanOther small statesPacific island small statesPakistanPanamaParaguayPhilippinesPre-demographic dividendQatarRwandaSao Tome and PrincipeSaudi ArabiaSenegalSerbiaSeychellesSierra LeoneSingaporeSmall statesSolomon IslandsSouth AfricaSt. Kitts and NevisSt. LuciaSt. Vincent and the GrenadinesSub-Saharan Africa Sub-Saharan Africa (excluding high income)Sub-Saharan Africa (IDA & IBRD countries)SurinameSwazilandSyrian Arab RepublicTajikistanTanzaniaTogoTongaTrinidad and TobagoTunisiaTurks and Caicos IslandsUgandaUnited Arab EmiratesUzbekistanVietnamWest Bank and GazaZambiaZimbabwe
Linha do tempo:
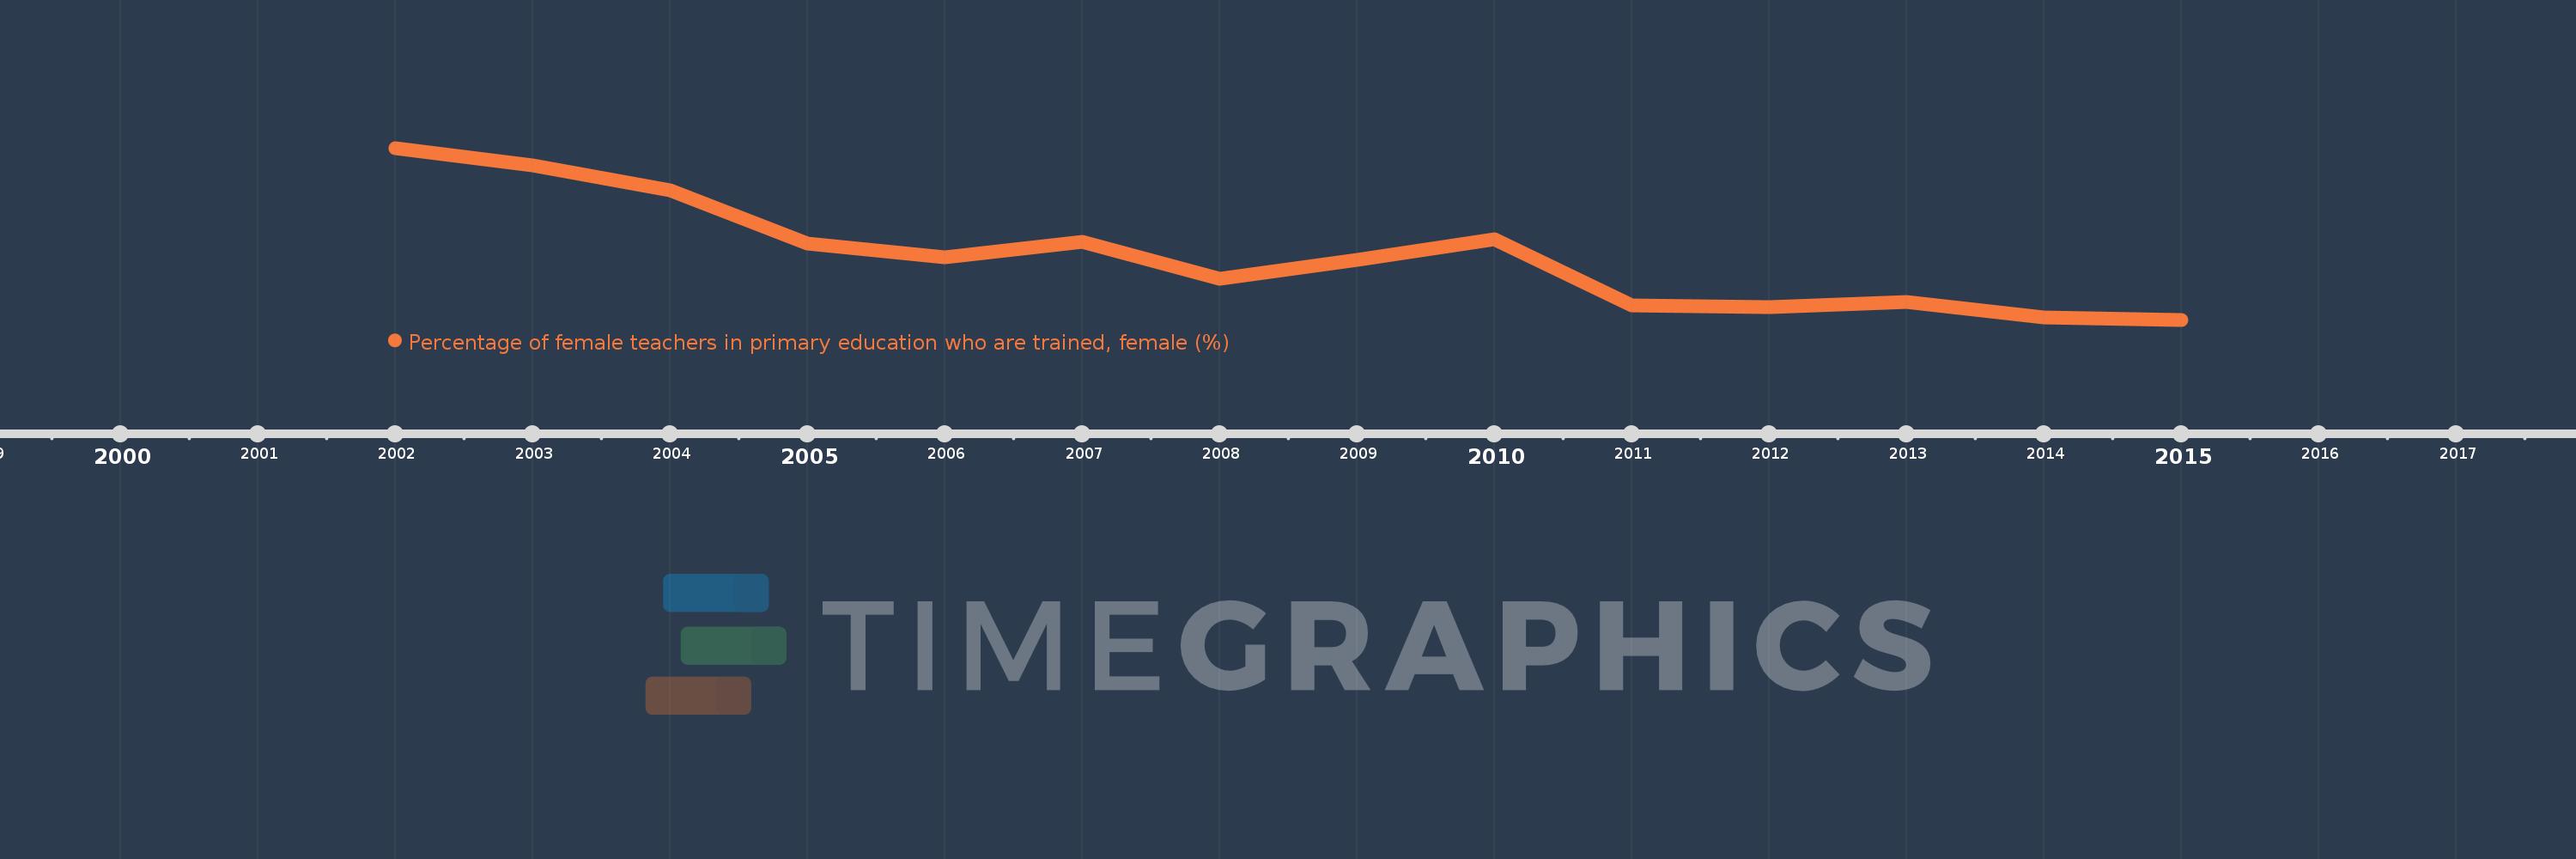
Nesta escala de tempo está apresentado um gráfico de 2002 ano até 2015 ano Sub-Saharan Africa . Dados de 2001 ano ausente. O número de observações reais por data: 14.
Fonte (nome):
Indicadores de desenvolvimento mundial
Fonte (organização):
United Nations Educational, Scientific, and Cultural Organization (UNESCO) Institute for Statistics.
Categorias:
Education, Gender
Foi atualizado:
23 abr 2017 ano
Indicadores de alterações dos valores ao longo dos anos
Em média:
79.696
Mínimo:
76.108
1 jan 2015 ano
Máximo:
85.71
1 jan 2002 ano
Na data de observação
Valor
Mudança absoluta
A alteração em relação ao valor anterior
1 jan 2002 ano
85.71
+85.71
0.0%
1 jan 2003 ano
84.719
-0.991
-1.16%
1 jan 2004 ano
83.327
-1.392
-1.64%
1 jan 2005 ano
80.387
-2.939
-3.53%
1 jan 2006 ano
79.577
-0.81
-1.01%
1 jan 2007 ano
80.463
+0.886
1.11%
1 jan 2008 ano
78.396
-2.067
-2.57%
1 jan 2009 ano
79.437
+1.041
1.33%
1 jan 2010 ano
80.591
+1.154
1.45%
1 jan 2011 ano
76.891
-3.7
-4.59%
1 jan 2012 ano
76.836
-0.056
-0.07%
1 jan 2013 ano
77.08
+0.245
0.32%
1 jan 2014 ano
76.224
-0.856
-1.11%
1 jan 2015 ano
76.108
-0.116
-0.15%
Classificação de países por estatísticas atuais por anos

Comentários:

Enviar
PremiumAbout & FeedbackAcordoPrivacidade
logo
© 2022 Selected Technologies LLC – Morgan Hill, California