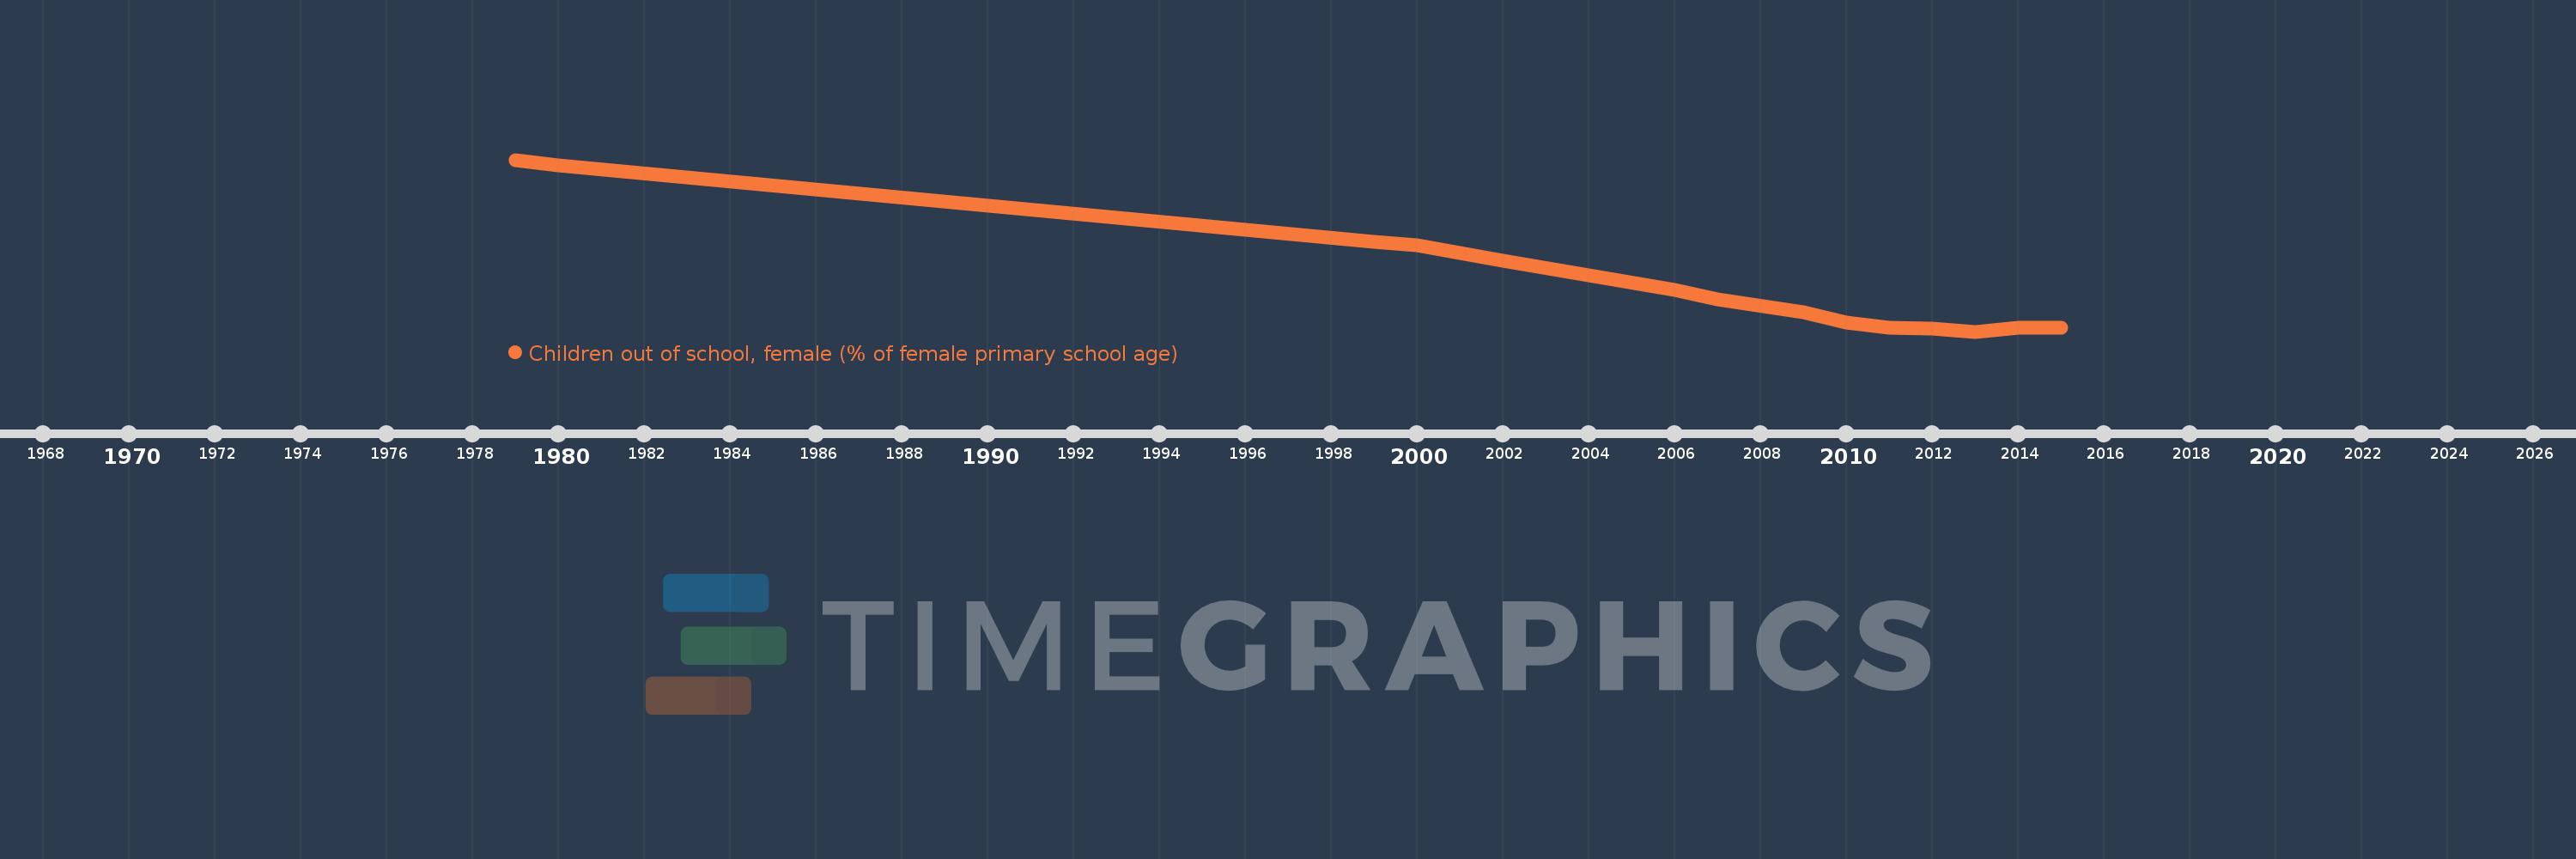
Questa scala temporale mostra un grafico dal 1979 anno al 2015 anno. Bhutan. I dati fino ad 1978 anno non disponibili. Il numero di osservazioni attuali secondo i date: 15.
La fonte (nome):
Indicatori dello sviluppo mondiale
La fonte (organizzazione):
United Nations Educational, Scientific, and Cultural Organization (UNESCO) Institute for Statistics.
Categorie:
Education
sono stati aggiornati
23 apr 2017 anni
Indicatori delle variazioni dei valori per anni
In media:
31.687
Minima:
7.869
1 gen 2013 anni
Massimo:
86.324
1 gen 1979 anni
Alla data di osservazione
Valore
Variazione assoluta
La variazione rispetto al valore precedente
1 gen 1979 anni
86.324
+86.324
0.0%
1 gen 1980 anni
83.962
-2.363
-2.74%
1 gen 1999 anni
48.94
-35.022
-41.71%
1 gen 2000 anni
47.39
-1.55
-3.17%
1 gen 2001 anni
43.823
-3.567
-7.53%
1 gen 2002 anni
40.133
-3.689
-8.42%
1 gen 2006 anni
26.922
-13.211
-32.92%
1 gen 2007 anni
22.764
-4.158
-15.44%
1 gen 2009 anni
16.711
-6.053
-26.59%
1 gen 2010 anni
12.055
-4.656
-27.86%
1 gen 2011 anni
9.826
-2.229
-18.49%
1 gen 2012 anni
9.272
-0.554
-5.64%
1 gen 2013 anni
7.869
-1.402
-15.12%
1 gen 2014 anni
9.58
+1.711
21.74%
1 gen 2015 anni
9.74
+0.16
1.67%
Classificazione dei paesi secondo i statistiche attuali per anni