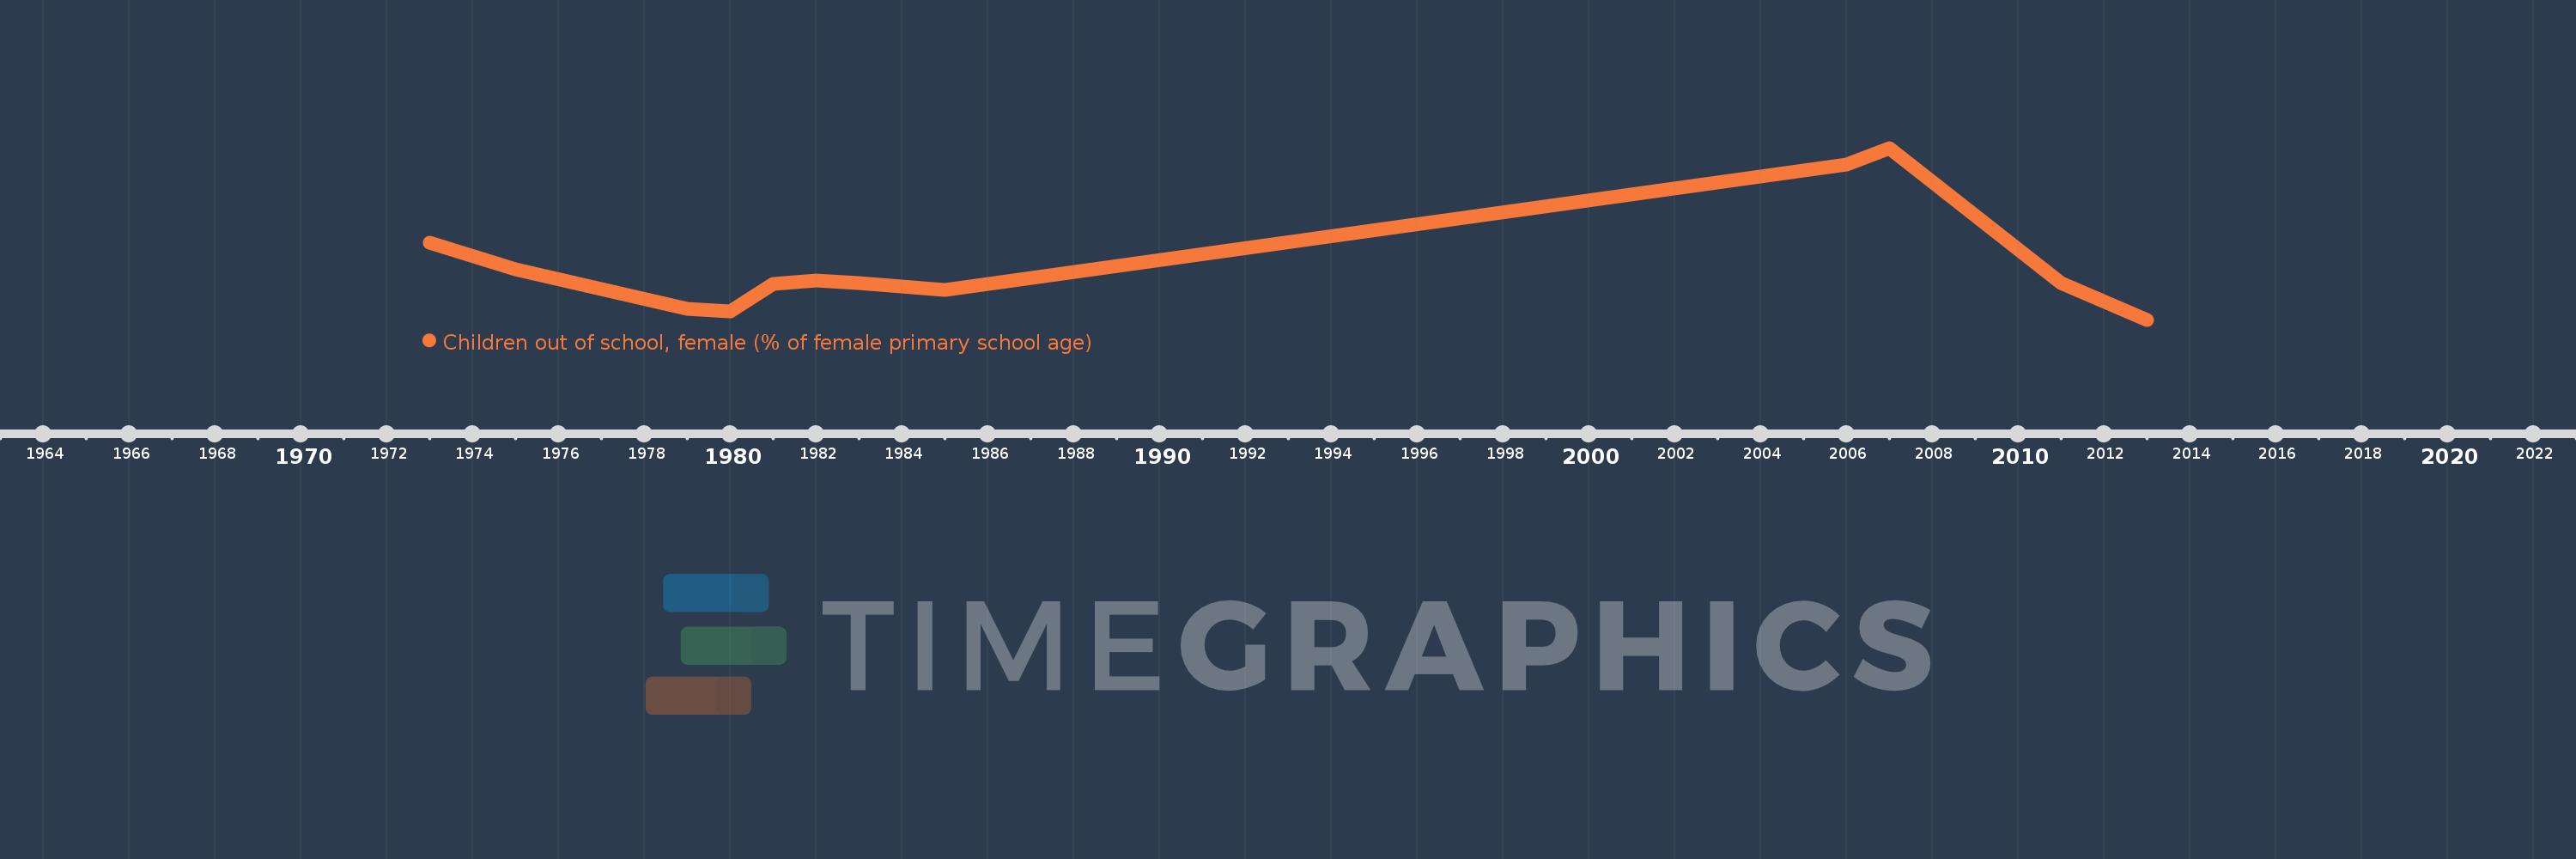
Questa scala temporale mostra un grafico dal 1973 anno al 2013 anno. Congo, Rep.. I dati fino ad 1972 anno non disponibili. Il numero di osservazioni attuali secondo i date: 14.
La fonte (nome):
Indicatori dello sviluppo mondiale
La fonte (organizzazione):
United Nations Educational, Scientific, and Cultural Organization (UNESCO) Institute for Statistics.
Categorie:
Education
sono stati aggiornati
23 apr 2017 anni
Indicatori delle variazioni dei valori per anni
In media:
15.93
Minima:
3.239
1 gen 2013 anni
Massimo:
45.941
1 gen 2007 anni
Alla data di osservazione
Valore
Variazione assoluta
La variazione rispetto al valore precedente
1 gen 1973 anni
22.29
+22.29
0.0%
1 gen 1975 anni
15.744
-6.546
-29.37%
1 gen 1977 anni
10.846
-4.899
-31.11%
1 gen 1979 anni
5.895
-4.95
-45.65%
1 gen 1980 anni
5.376
-0.519
-8.8%
1 gen 1981 anni
12.112
+6.736
125.29%
1 gen 1982 anni
13.064
+0.953
7.86%
1 gen 1983 anni
12.293
-0.771
-5.9%
1 gen 1984 anni
11.4
-0.893
-7.27%
1 gen 1985 anni
10.605
-0.795
-6.97%
1 gen 2006 anni
41.83
+31.225
294.44%
1 gen 2007 anni
45.941
+4.111
9.83%
1 gen 2011 anni
12.39
-33.551
-73.03%
1 gen 2013 anni
3.239
-9.151
-73.86%
Classificazione dei paesi secondo i statistiche attuali per anni