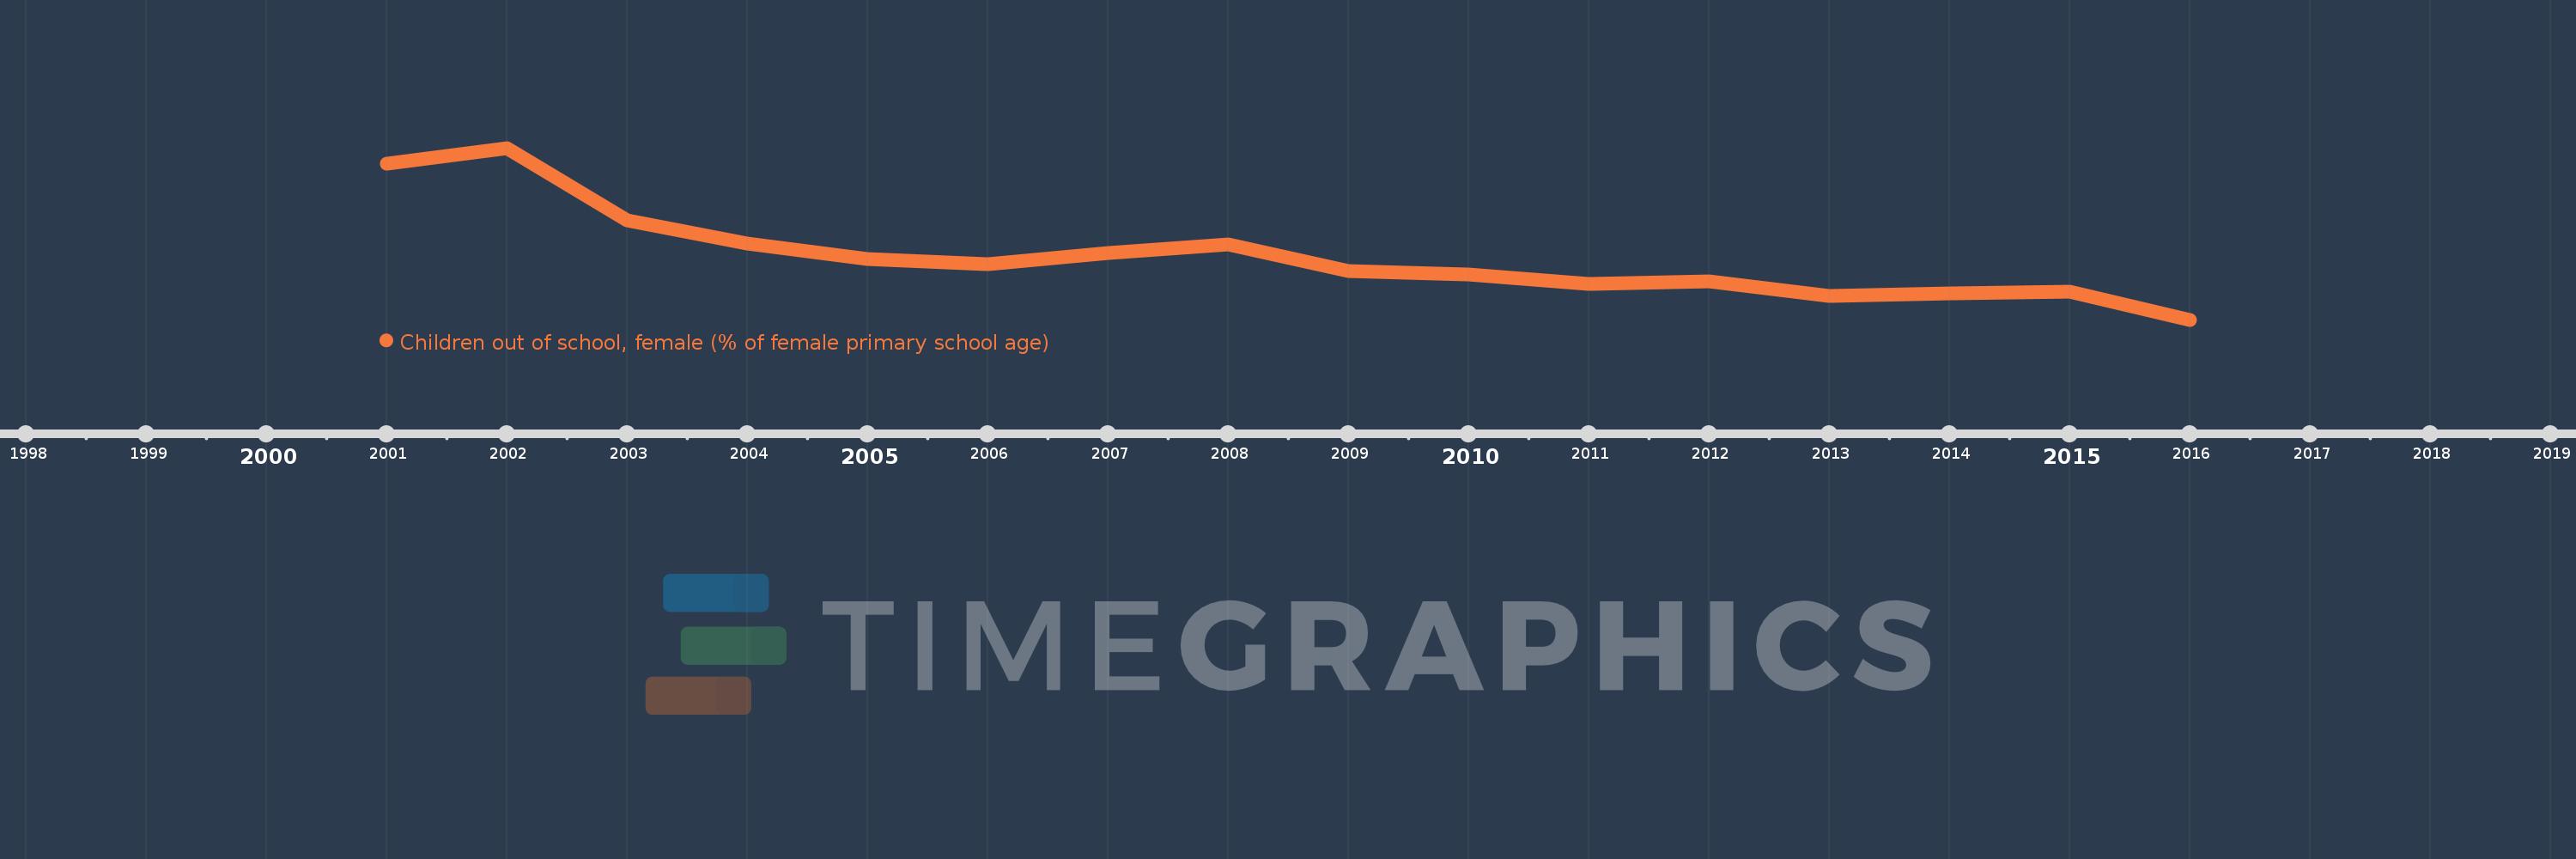
Questa scala temporale mostra un grafico dal 2001 anno al 2016 anno. Tajikistan. I dati fino ad 2000 anno non disponibili. Il numero di osservazioni attuali secondo i date: 16.
La fonte (nome):
Indicatori dello sviluppo mondiale
La fonte (organizzazione):
United Nations Educational, Scientific, and Cultural Organization (UNESCO) Institute for Statistics.
Categorie:
Education
sono stati aggiornati
23 apr 2017 anni
Indicatori delle variazioni dei valori per anni
In media:
4.583
Minima:
1.671
1 gen 2016 anni
Massimo:
9.599
1 gen 2002 anni
Alla data di osservazione
Valore
Variazione assoluta
La variazione rispetto al valore precedente
1 gen 2001 anni
8.887
+8.887
0.0%
1 gen 2002 anni
9.599
+0.711
8.0%
1 gen 2003 anni
6.275
-3.324
-34.63%
1 gen 2004 anni
5.203
-1.072
-17.08%
1 gen 2005 anni
4.487
-0.716
-13.76%
1 gen 2006 anni
4.234
-0.253
-5.65%
1 gen 2007 anni
4.76
+0.526
12.42%
1 gen 2008 anni
5.143
+0.383
8.05%
1 gen 2009 anni
3.937
-1.206
-23.45%
1 gen 2010 anni
3.745
-0.192
-4.87%
1 gen 2011 anni
3.331
-0.414
-11.05%
1 gen 2012 anni
3.445
+0.113
3.4%
1 gen 2013 anni
2.759
-0.685
-19.89%
1 gen 2014 anni
2.896
+0.137
4.96%
1 gen 2015 anni
2.952
+0.056
1.93%
1 gen 2016 anni
1.671
-1.281
-43.39%
Classificazione dei paesi secondo i statistiche attuali per anni