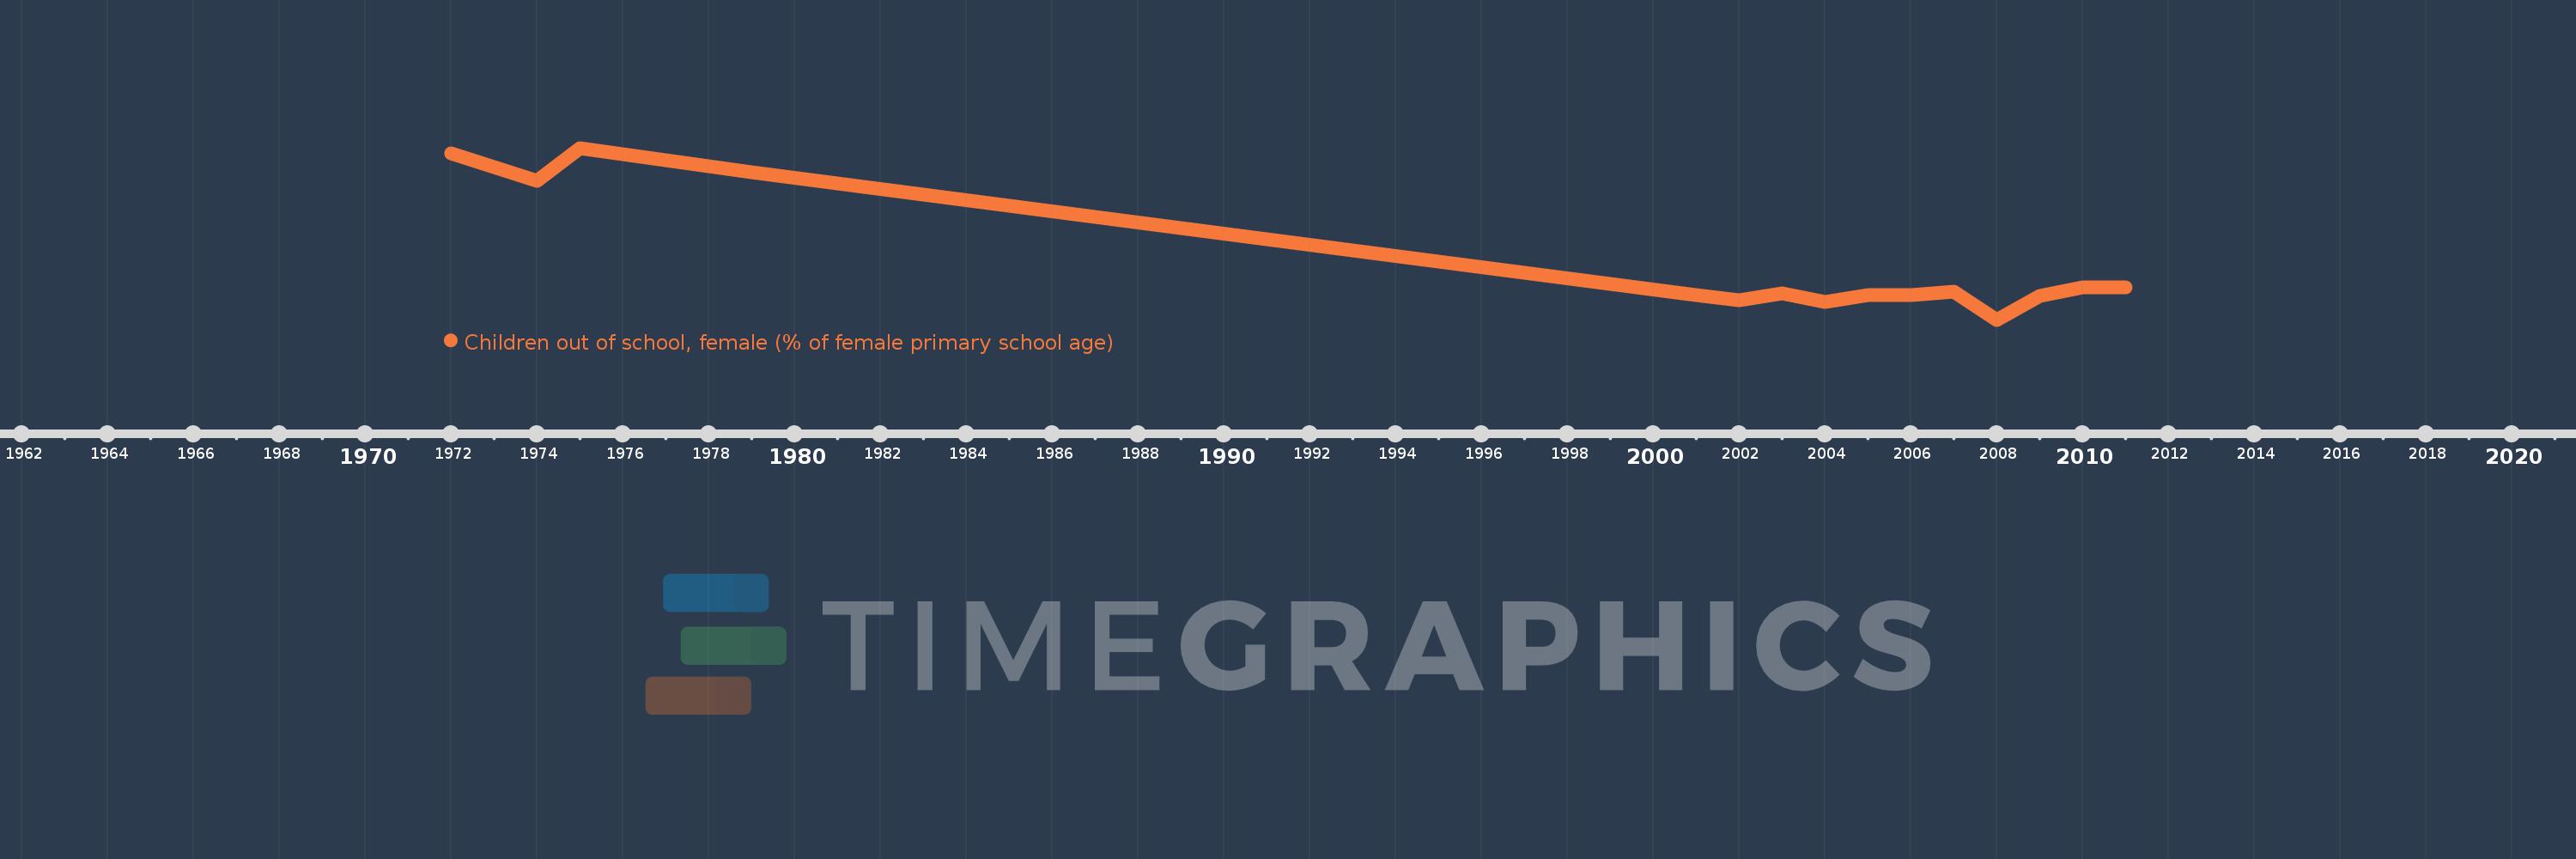
Questa scala temporale mostra un grafico dal 1972 anno al 2011 anno. Myanmar. I dati fino ad 1971 anno non disponibili. Il numero di osservazioni attuali secondo i date: 15.
La fonte (nome):
Indicatori dello sviluppo mondiale
La fonte (organizzazione):
United Nations Educational, Scientific, and Cultural Organization (UNESCO) Institute for Statistics.
Categorie:
Education
sono stati aggiornati
23 apr 2017 anni
Indicatori delle variazioni dei valori per anni
In media:
18.542
Minima:
5.637
1 gen 2008 anni
Massimo:
43.437
1 gen 1975 anni
Alla data di osservazione
Valore
Variazione assoluta
La variazione rispetto al valore precedente
1 gen 1972 anni
42.168
+42.168
0.0%
1 gen 1974 anni
36.274
-5.894
-13.98%
1 gen 1975 anni
43.437
+7.163
19.75%
1 gen 1979 anni
38.107
-5.33
-12.27%
1 gen 2001 anni
11.075
-27.032
-70.94%
1 gen 2002 anni
9.918
-1.157
-10.45%
1 gen 2003 anni
11.494
+1.576
15.89%
1 gen 2004 anni
9.623
-1.871
-16.28%
1 gen 2005 anni
11.077
+1.454
15.11%
1 gen 2006 anni
11.022
-0.055
-0.5%
1 gen 2007 anni
11.874
+0.852
7.73%
1 gen 2008 anni
5.637
-6.237
-52.52%
1 gen 2009 anni
10.958
+5.321
94.39%
1 gen 2010 anni
12.715
+1.756
16.03%
1 gen 2011 anni
12.749
+0.035
0.27%
Classificazione dei paesi secondo i statistiche attuali per anni