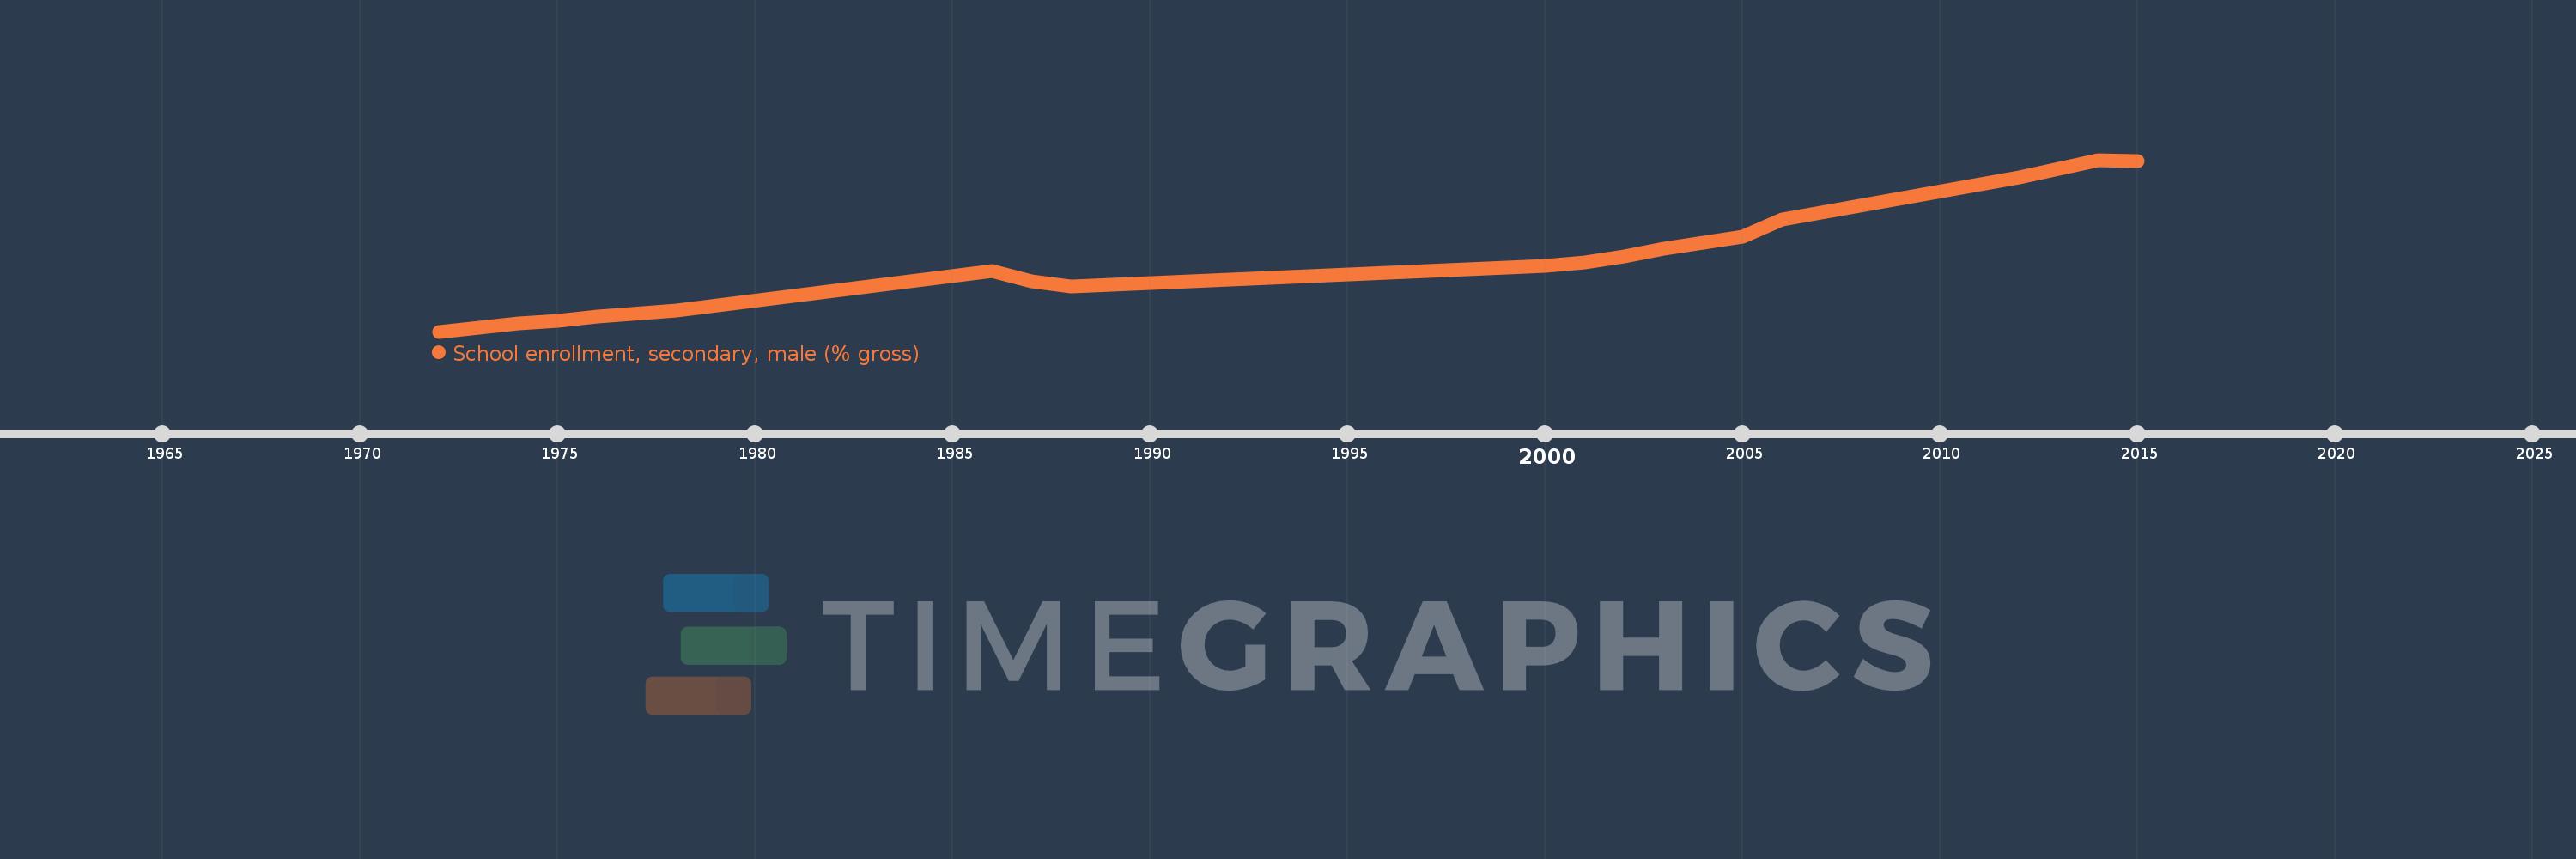
Questa scala temporale mostra un grafico dal 1972 anno al 2015 anno. Benin. I dati fino ad 1971 anno non disponibili. Il numero di osservazioni attuali secondo i date: 18.
La fonte (nome):
Indicatori dello sviluppo mondiale
La fonte (organizzazione):
United Nations Educational, Scientific, and Cultural Organization (UNESCO) Institute for Statistics.
Categorie:
Education, Gender
sono stati aggiornati
23 apr 2017 anni
Indicatori delle variazioni dei valori per anni
In media:
30.9
Minima:
5.996
1 gen 1972 anni
Massimo:
65.366
1 gen 2014 anni
Alla data di osservazione
Valore
Variazione assoluta
La variazione rispetto al valore precedente
1 gen 1972 anni
5.996
+5.996
0.0%
1 gen 1974 anni
8.871
+2.875
47.96%
1 gen 1975 anni
9.852
+0.981
11.06%
1 gen 1976 anni
11.115
+1.263
12.82%
1 gen 1978 anni
13.277
+2.162
19.45%
1 gen 1986 anni
26.853
+13.576
102.26%
1 gen 1987 anni
23.36
-3.493
-13.01%
1 gen 1988 anni
21.599
-1.761
-7.54%
1 gen 2000 anni
28.806
+7.207
33.36%
1 gen 2001 anni
29.989
+1.183
4.11%
1 gen 2002 anni
32.098
+2.109
7.03%
1 gen 2003 anni
34.703
+2.605
8.12%
1 gen 2004 anni
36.586
+1.884
5.43%
1 gen 2005 anni
38.893
+2.306
6.3%
1 gen 2006 anni
44.795
+5.903
15.18%
1 gen 2012 anni
59.236
+14.441
32.24%
1 gen 2014 anni
65.366
+6.13
10.35%
1 gen 2015 anni
64.813
-0.553
-0.85%
Classificazione dei paesi secondo i statistiche attuali per anni