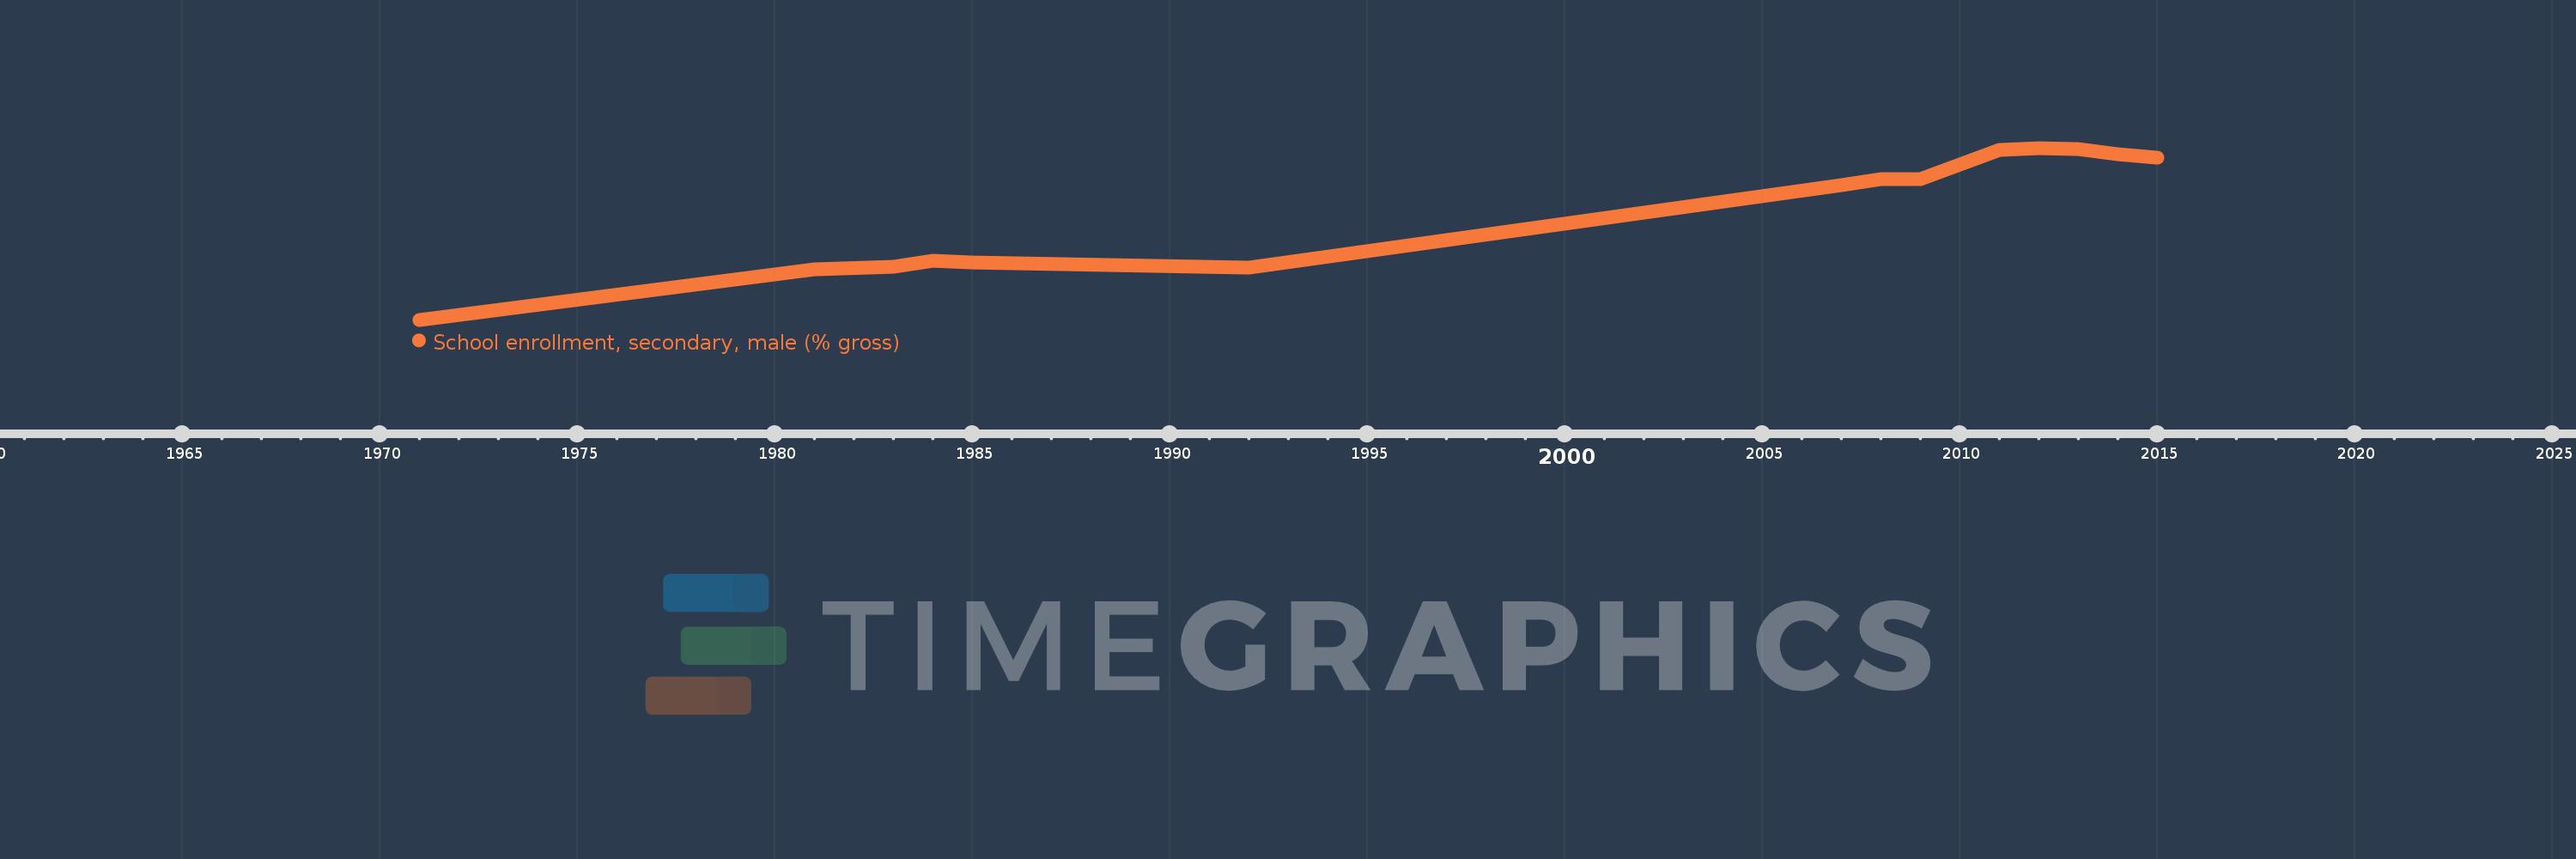
Questa scala temporale mostra un grafico dal 1971 anno al 2015 anno. Honduras. I dati fino ad 1970 anno non disponibili. Il numero di osservazioni attuali secondo i date: 14.
La fonte (nome):
Indicatori dello sviluppo mondiale
La fonte (organizzazione):
United Nations Educational, Scientific, and Cultural Organization (UNESCO) Institute for Statistics.
Categorie:
Education, Gender
sono stati aggiornati
23 apr 2017 anni
Indicatori delle variazioni dei valori per anni
In media:
46.972
Minima:
13.573
1 gen 1971 anni
Massimo:
66.176
1 gen 2012 anni
Alla data di osservazione
Valore
Variazione assoluta
La variazione rispetto al valore precedente
1 gen 1971 anni
13.573
+13.573
0.0%
1 gen 1981 anni
28.986
+15.412
113.54%
1 gen 1983 anni
29.925
+0.94
3.24%
1 gen 1984 anni
31.555
+1.63
5.45%
1 gen 1985 anni
31.03
-0.525
-1.66%
1 gen 1992 anni
29.58
-1.45
-4.67%
1 gen 2007 anni
54.801
+25.221
85.26%
1 gen 2008 anni
56.656
+1.855
3.38%
1 gen 2009 anni
56.741
+0.085
0.15%
1 gen 2011 anni
65.475
+8.733
15.39%
1 gen 2012 anni
66.176
+0.702
1.07%
1 gen 2013 anni
65.748
-0.428
-0.65%
1 gen 2014 anni
64.17
-1.578
-2.4%
1 gen 2015 anni
63.188
-0.982
-1.53%
Classificazione dei paesi secondo i statistiche attuali per anni