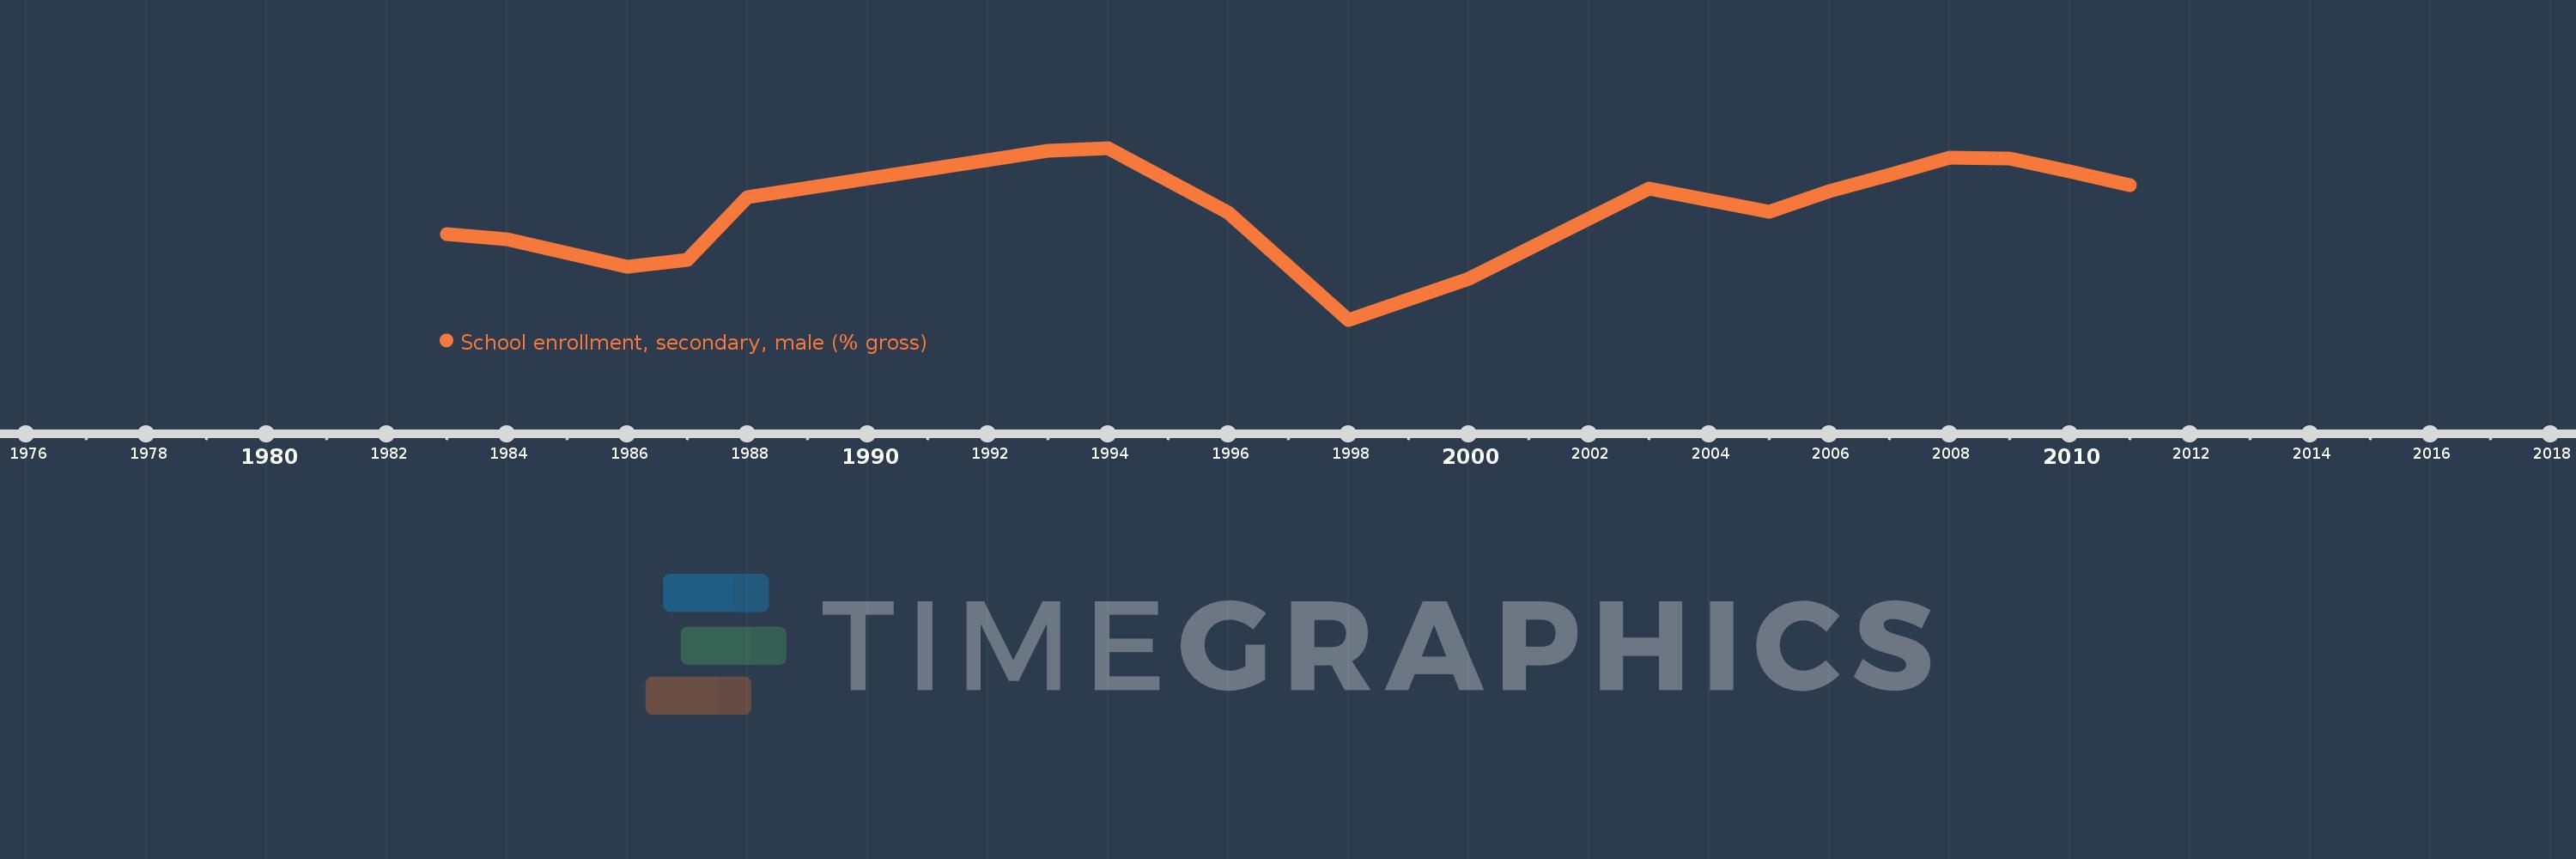
Questa scala temporale mostra un grafico dal 1983 anno al 2011 anno. Bahamas, The. I dati fino ad 1982 anno non disponibili. Il numero di osservazioni attuali secondo i date: 18.
La fonte (nome):
Indicatori dello sviluppo mondiale
La fonte (organizzazione):
United Nations Educational, Scientific, and Cultural Organization (UNESCO) Institute for Statistics.
Categorie:
Education, Gender
sono stati aggiornati
23 apr 2017 anni
Indicatori delle variazioni dei valori per anni
In media:
87.299
Minima:
73.049
1 gen 1998 anni
Massimo:
94.959
1 gen 1994 anni
Alla data di osservazione
Valore
Variazione assoluta
La variazione rispetto al valore precedente
1 gen 1983 anni
83.978
+83.978
0.0%
1 gen 1984 anni
83.31
-0.668
-0.8%
1 gen 1986 anni
79.862
-3.448
-4.14%
1 gen 1987 anni
80.677
+0.815
1.02%
1 gen 1988 anni
88.696
+8.019
9.94%
1 gen 1993 anni
94.603
+5.907
6.66%
1 gen 1994 anni
94.959
+0.357
0.38%
1 gen 1996 anni
86.75
-8.209
-8.65%
1 gen 1998 anni
73.049
-13.701
-15.79%
1 gen 2000 anni
78.224
+5.175
7.08%
1 gen 2003 anni
89.816
+11.592
14.82%
1 gen 2005 anni
86.819
-2.997
-3.34%
1 gen 2006 anni
89.462
+2.643
3.04%
1 gen 2007 anni
91.517
+2.055
2.3%
1 gen 2008 anni
93.758
+2.241
2.45%
1 gen 2009 anni
93.66
-0.099
-0.11%
1 gen 2010 anni
92.016
-1.644
-1.76%
1 gen 2011 anni
90.234
-1.782
-1.94%
Classificazione dei paesi secondo i statistiche attuali per anni