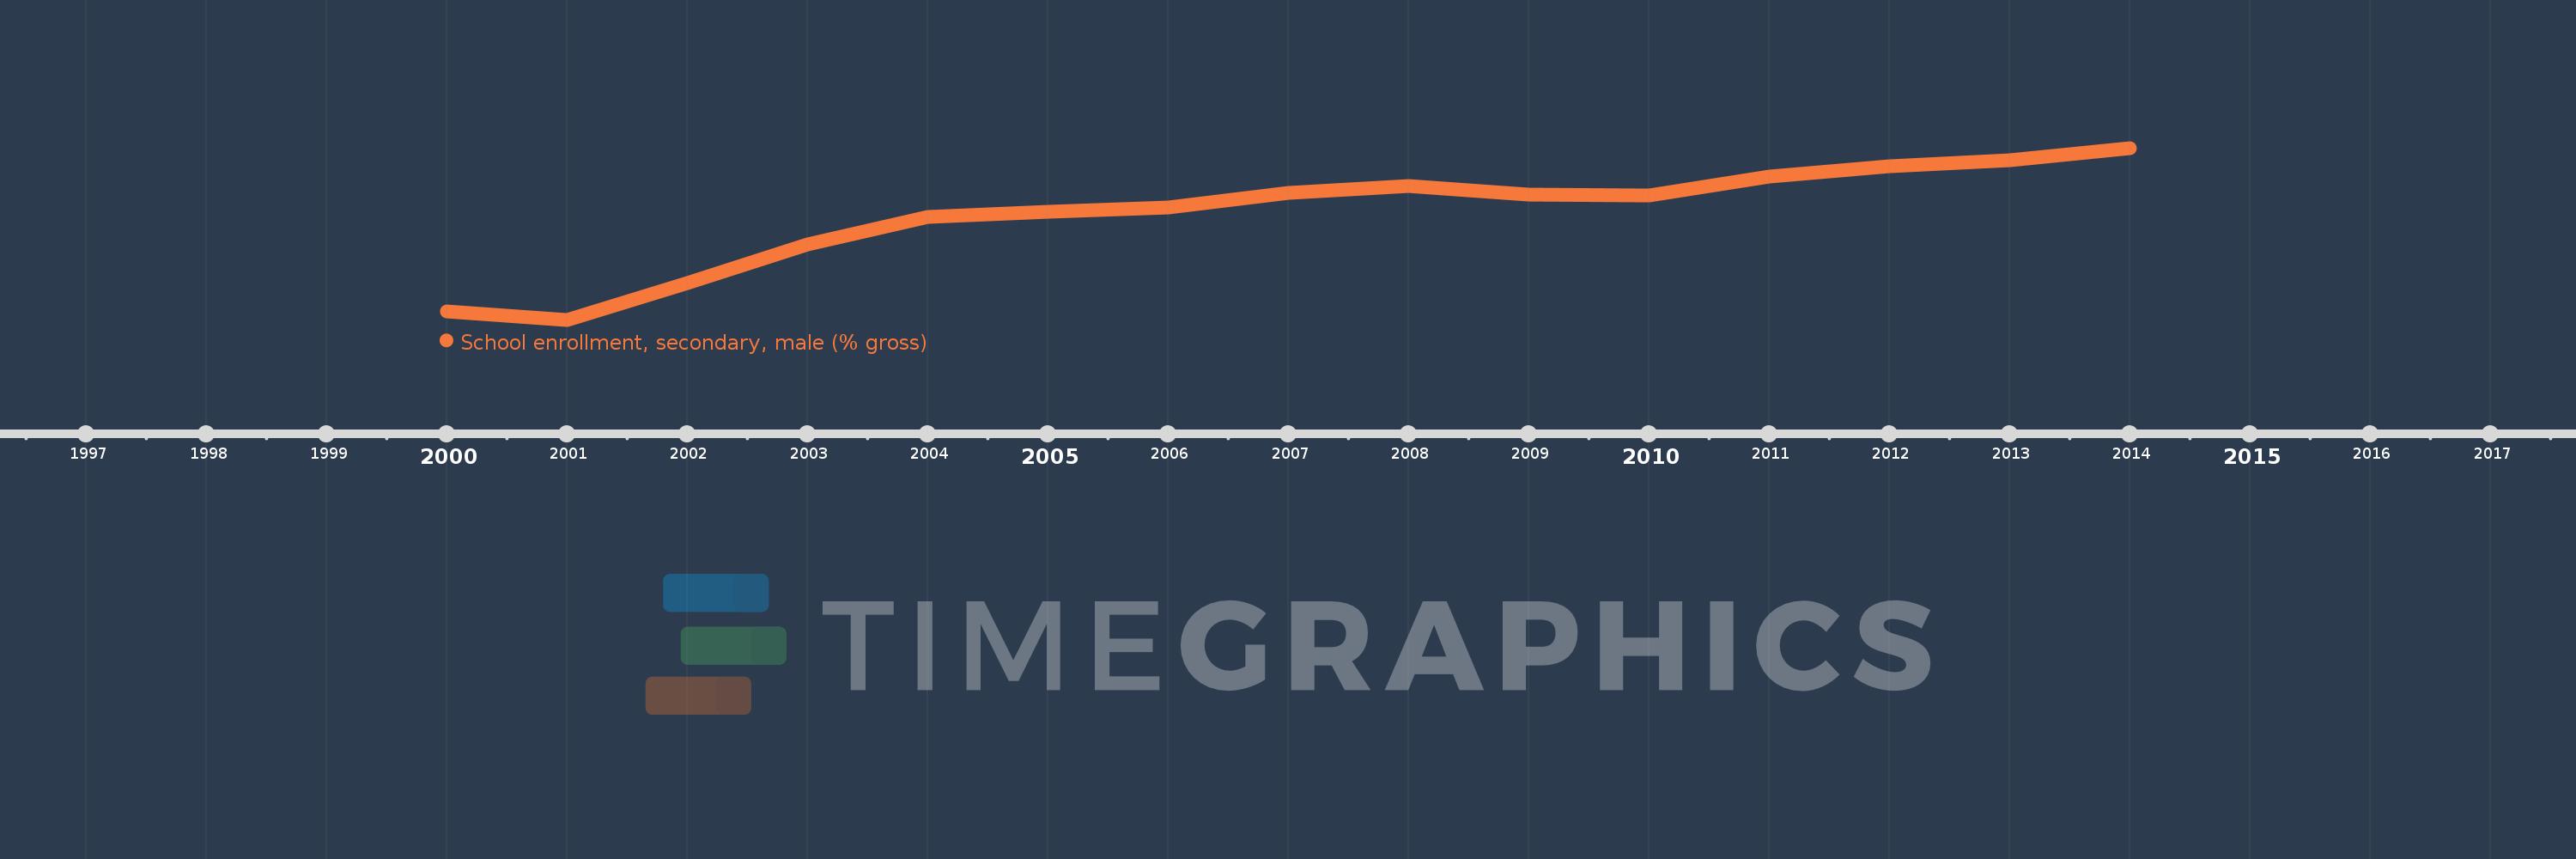
Questa scala temporale mostra un grafico dal 2000 anno al 2014 anno. Tajikistan. I dati fino ad 1999 anno non disponibili. Il numero di osservazioni attuali secondo i date: 15.
La fonte (nome):
Indicatori dello sviluppo mondiale
La fonte (organizzazione):
United Nations Educational, Scientific, and Cultural Organization (UNESCO) Institute for Statistics.
Categorie:
Education, Gender
sono stati aggiornati
23 apr 2017 anni
Indicatori delle variazioni dei valori per anni
In media:
87.186
Minima:
78.788
1 gen 2001 anni
Massimo:
92.465
1 gen 2014 anni
Alla data di osservazione
Valore
Variazione assoluta
La variazione rispetto al valore precedente
1 gen 2000 anni
79.468
+79.468
0.0%
1 gen 2001 anni
78.788
-0.68
-0.86%
1 gen 2002 anni
81.715
+2.927
3.72%
1 gen 2003 anni
84.789
+3.074
3.76%
1 gen 2004 anni
86.998
+2.209
2.6%
1 gen 2005 anni
87.356
+0.359
0.41%
1 gen 2006 anni
87.739
+0.382
0.44%
1 gen 2007 anni
88.914
+1.175
1.34%
1 gen 2008 anni
89.44
+0.525
0.59%
1 gen 2009 anni
88.768
-0.671
-0.75%
1 gen 2010 anni
88.681
-0.088
-0.1%
1 gen 2011 anni
90.191
+1.51
1.7%
1 gen 2012 anni
91.022
+0.831
0.92%
1 gen 2013 anni
91.457
+0.436
0.48%
1 gen 2014 anni
92.465
+1.007
1.1%
Classificazione dei paesi secondo i statistiche attuali per anni