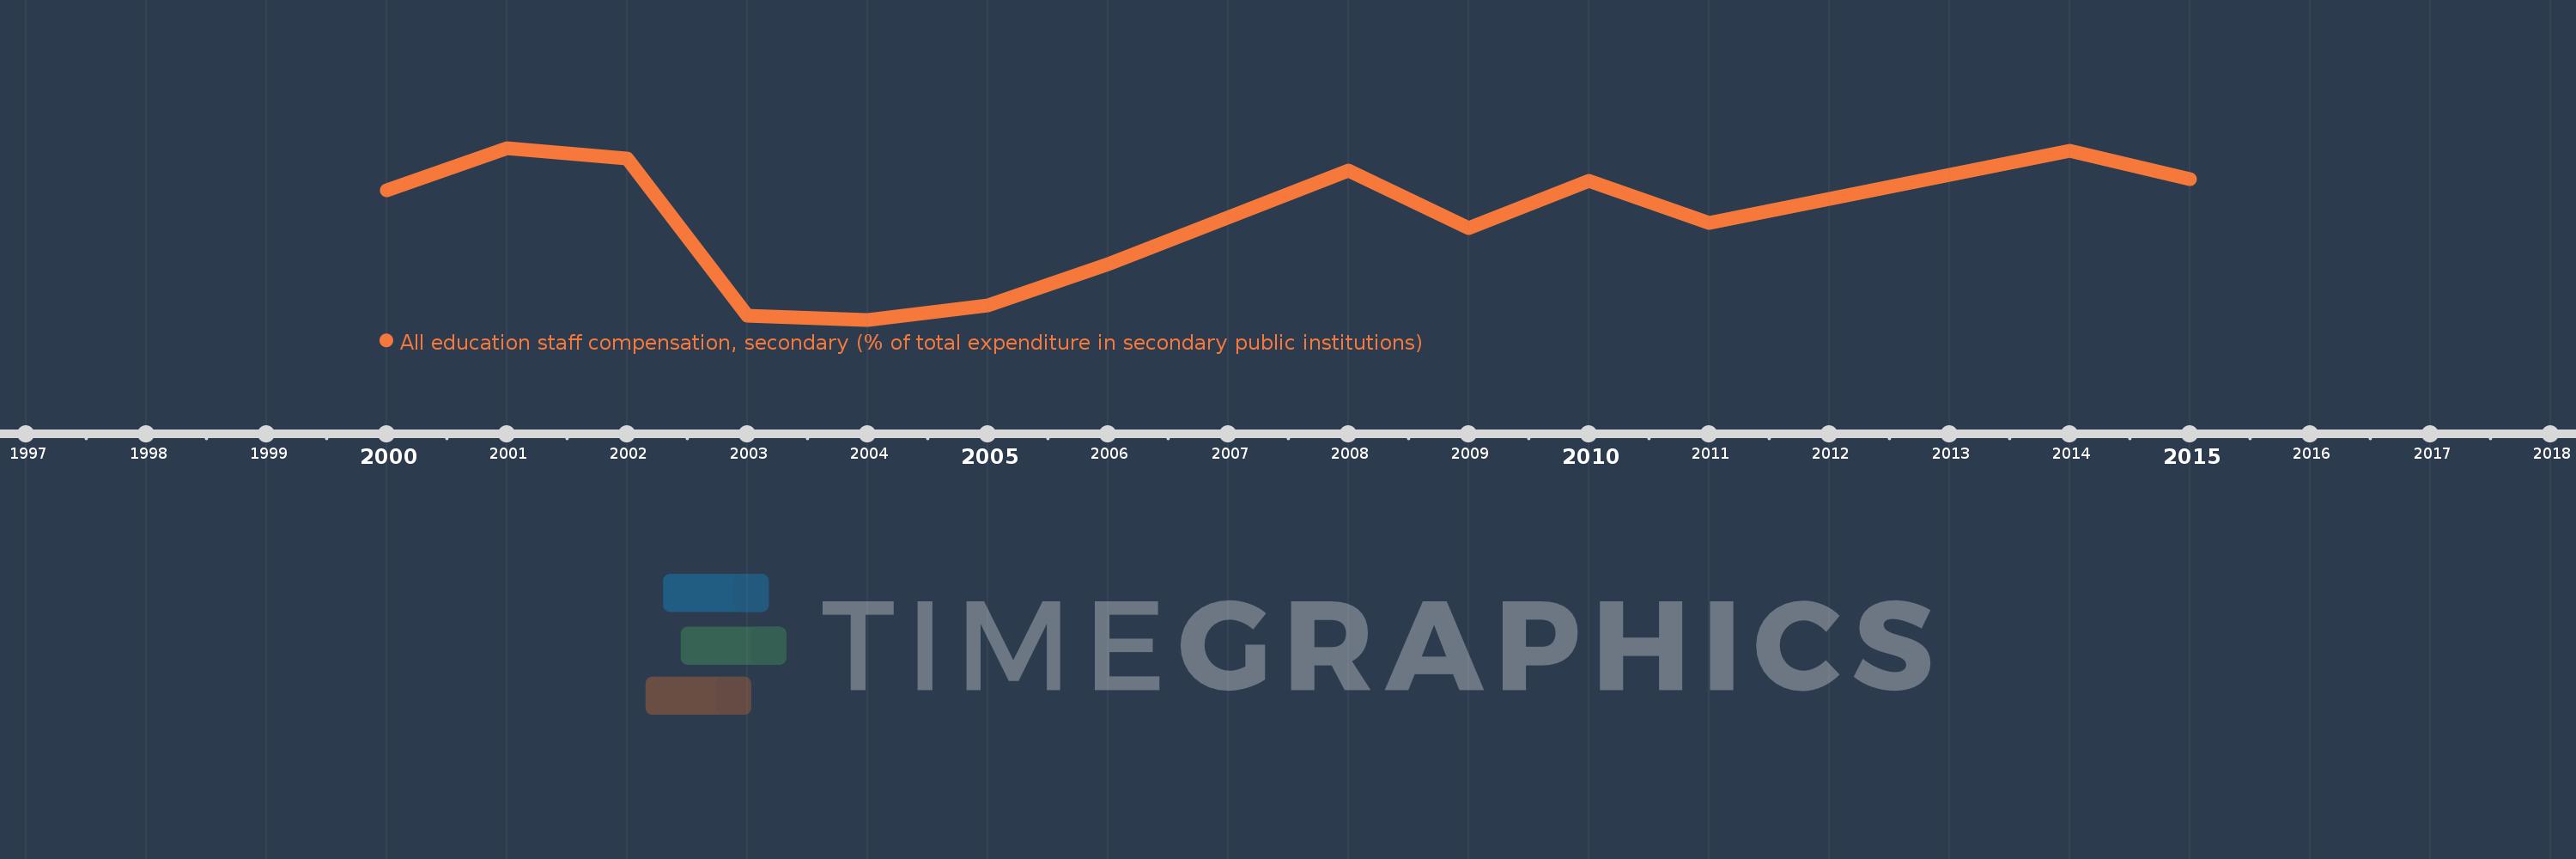
Questa scala temporale mostra un grafico dal 2000 anno al 2015 anno. Barbados. I dati fino ad 1999 anno non disponibili. Il numero di osservazioni attuali secondo i date: 13.
La fonte (nome):
Indicatori dello sviluppo mondiale
La fonte (organizzazione):
United Nations Educational, Scientific, and Cultural Organization (UNESCO) Institute for Statistics.
Categorie:
Education
sono stati aggiornati
23 apr 2017 anni
Indicatori delle variazioni dei valori per anni
In media:
82.327
Minima:
61.231
1 gen 2004 anni
Massimo:
96.861
1 gen 2001 anni
Alla data di osservazione
Valore
Variazione assoluta
La variazione rispetto al valore precedente
1 gen 2000 anni
88.087
+88.087
0.0%
1 gen 2001 anni
96.861
+8.775
9.96%
1 gen 2002 anni
94.608
-2.253
-2.33%
1 gen 2003 anni
62.143
-32.465
-34.32%
1 gen 2004 anni
61.231
-0.912
-1.47%
1 gen 2005 anni
64.118
+2.887
4.71%
1 gen 2006 anni
72.819
+8.701
13.57%
1 gen 2008 anni
92.192
+19.373
26.6%
1 gen 2009 anni
80.215
-11.977
-12.99%
1 gen 2010 anni
90.055
+9.84
12.27%
1 gen 2011 anni
81.223
-8.832
-9.81%
1 gen 2014 anni
96.319
+15.096
18.59%
1 gen 2015 anni
90.375
-5.944
-6.17%
Classificazione dei paesi secondo i statistiche attuali per anni