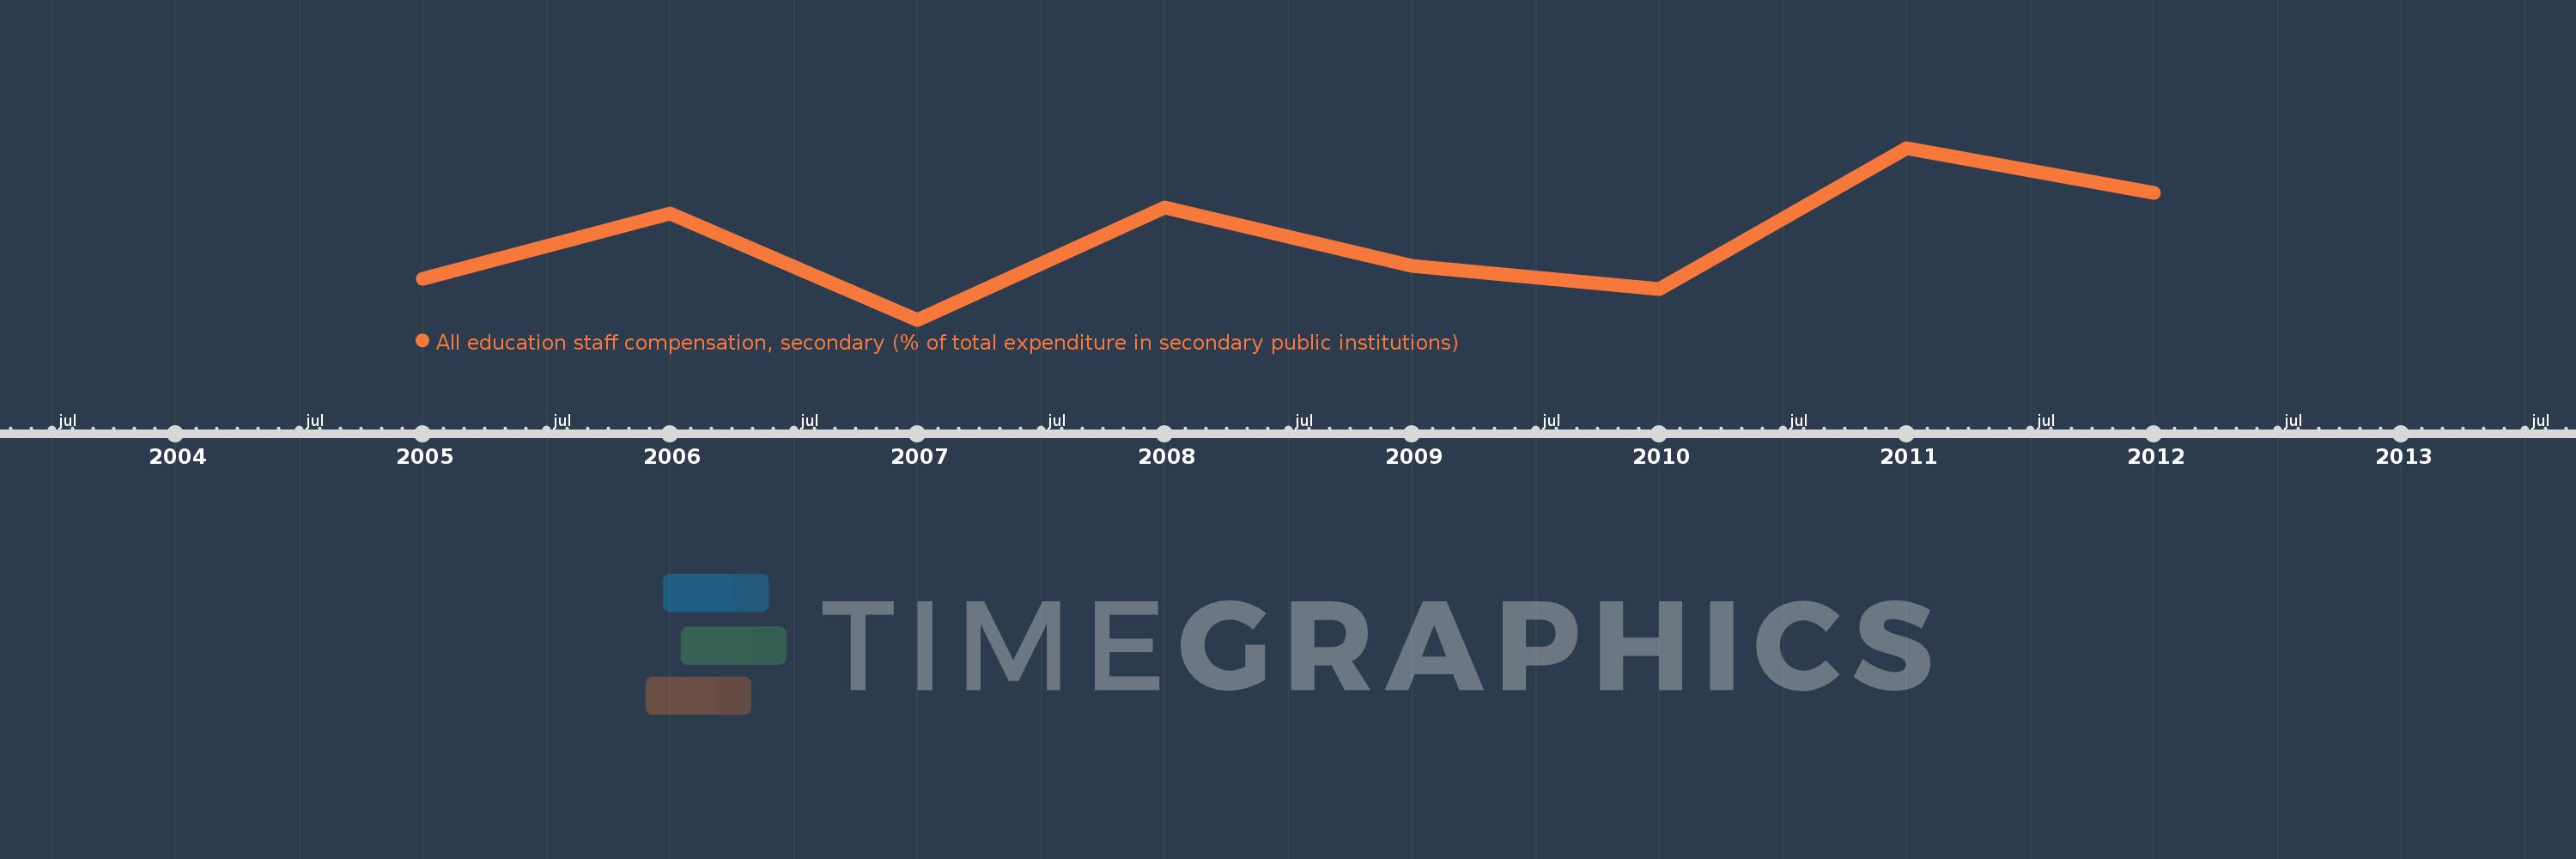
Questa scala temporale mostra un grafico dal 2005 anno al 2012 anno. Iceland. I dati fino ad 2004 anno non disponibili. Il numero di osservazioni attuali secondo i date: 8.
La fonte (nome):
Indicatori dello sviluppo mondiale
La fonte (organizzazione):
United Nations Educational, Scientific, and Cultural Organization (UNESCO) Institute for Statistics.
Categorie:
Education
sono stati aggiornati
23 apr 2017 anni
Indicatori delle variazioni dei valori per anni
In media:
70.143
Minima:
66.389
1 gen 2007 anni
Massimo:
74.423
1 gen 2011 anni
Alla data di osservazione
Valore
Variazione assoluta
La variazione rispetto al valore precedente
1 gen 2005 anni
68.303
+68.303
0.0%
1 gen 2006 anni
71.362
+3.059
4.48%
1 gen 2007 anni
66.389
-4.973
-6.97%
1 gen 2008 anni
71.647
+5.259
7.92%
1 gen 2009 anni
68.899
-2.749
-3.84%
1 gen 2010 anni
67.807
-1.092
-1.58%
1 gen 2011 anni
74.423
+6.616
9.76%
1 gen 2012 anni
72.312
-2.11
-2.84%
Classificazione dei paesi secondo i statistiche attuali per anni