Download Queste statistiche in altri paesi:
Linea del tempo:
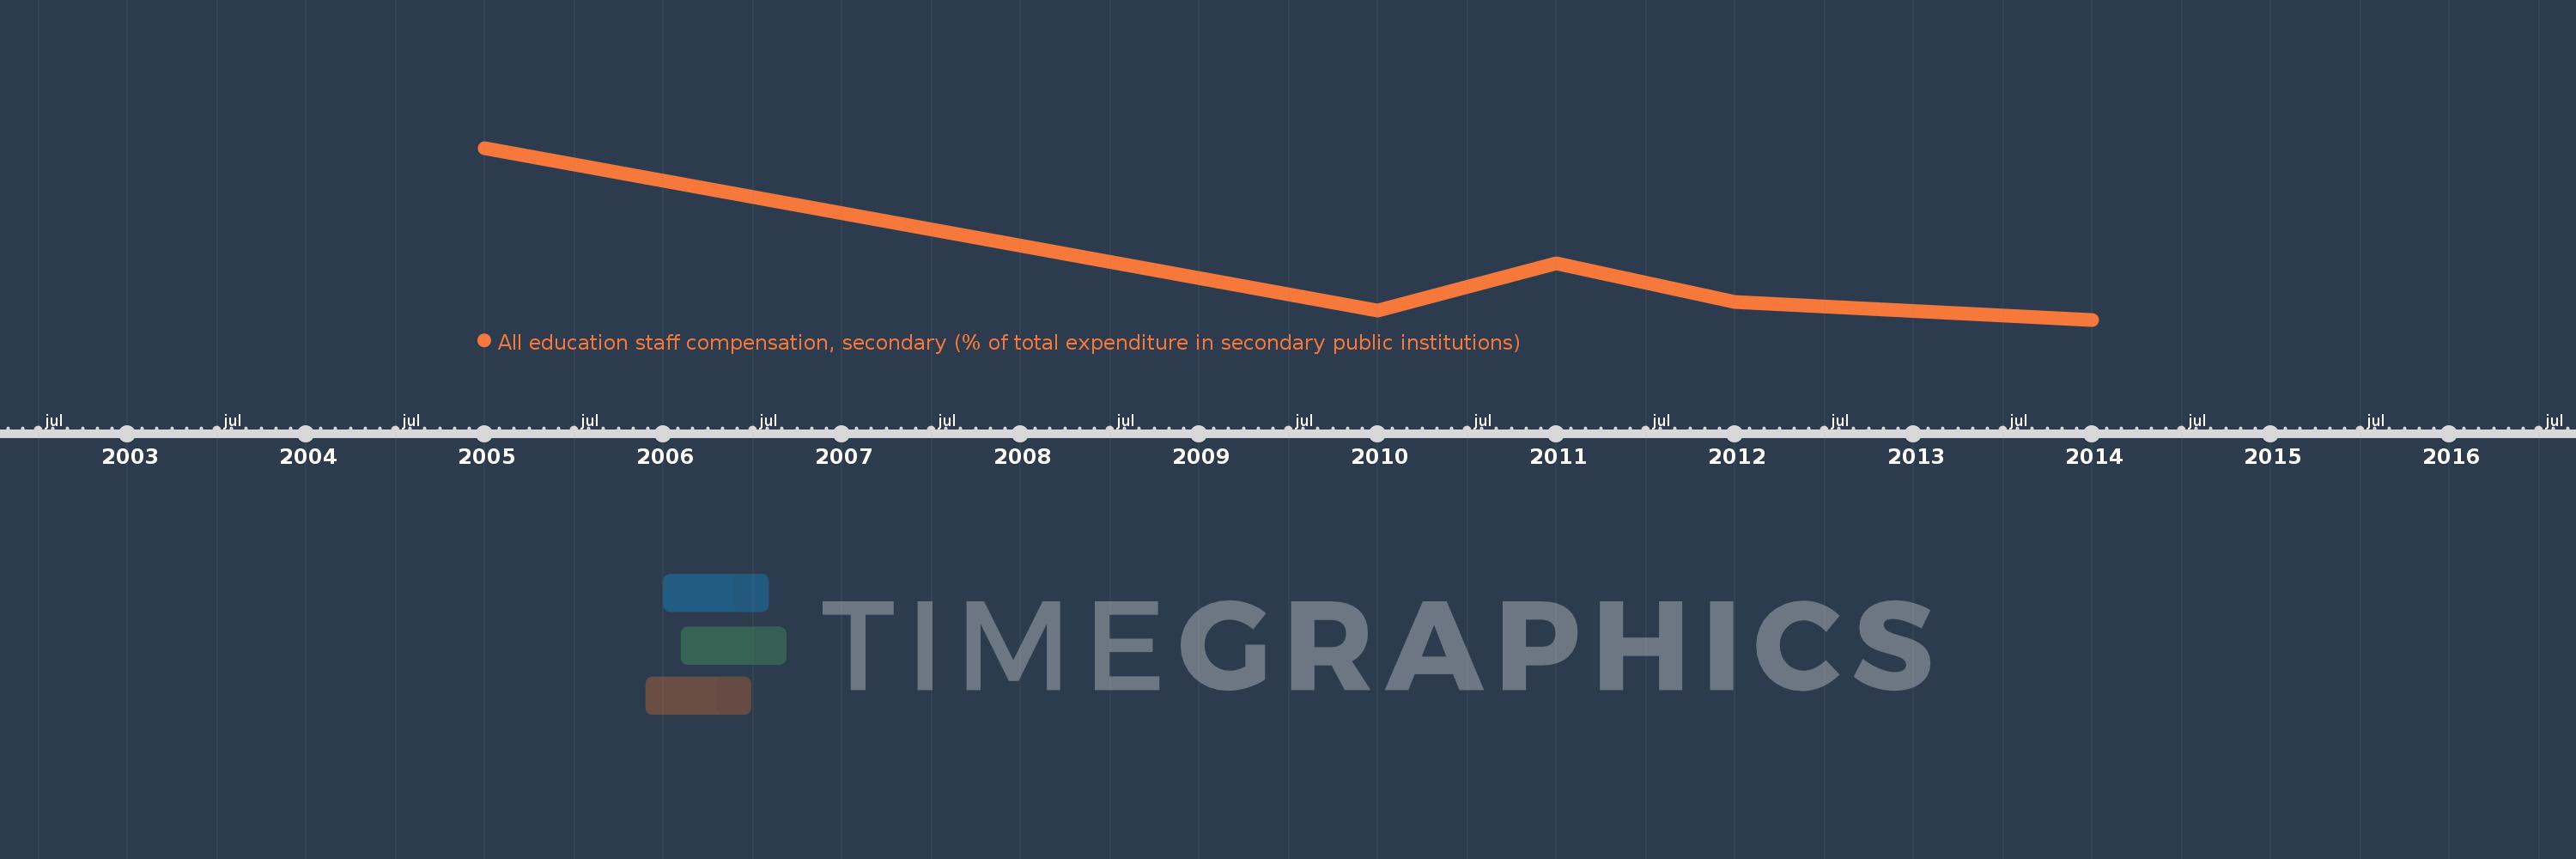
Questa scala temporale mostra un grafico dal 2005 anno al 2014 anno. Uganda. I dati fino ad 2004 anno non disponibili. Il numero di osservazioni attuali secondo i date: 5.
La fonte (nome):
Indicatori dello sviluppo mondiale
La fonte (organizzazione):
United Nations Educational, Scientific, and Cultural Organization (UNESCO) Institute for Statistics.
Categorie:
Education
sono stati aggiornati
23 apr 2017 anni
Indicatori delle variazioni dei valori per anni
Minima:
50.604
1 gen 2014 anni
Massimo:
78.762
1 gen 2005 anni
Alla data di osservazione
Valore
Variazione assoluta
La variazione rispetto al valore precedente
1 gen 2005 anni
78.762
+78.762
0.0%
1 gen 2010 anni
52.151
-26.611
-33.79%
1 gen 2011 anni
59.896
+7.746
14.85%
1 gen 2012 anni
53.532
-6.365
-10.63%
1 gen 2014 anni
50.604
-2.927
-5.47%
Classificazione dei paesi secondo i statistiche attuali per anni