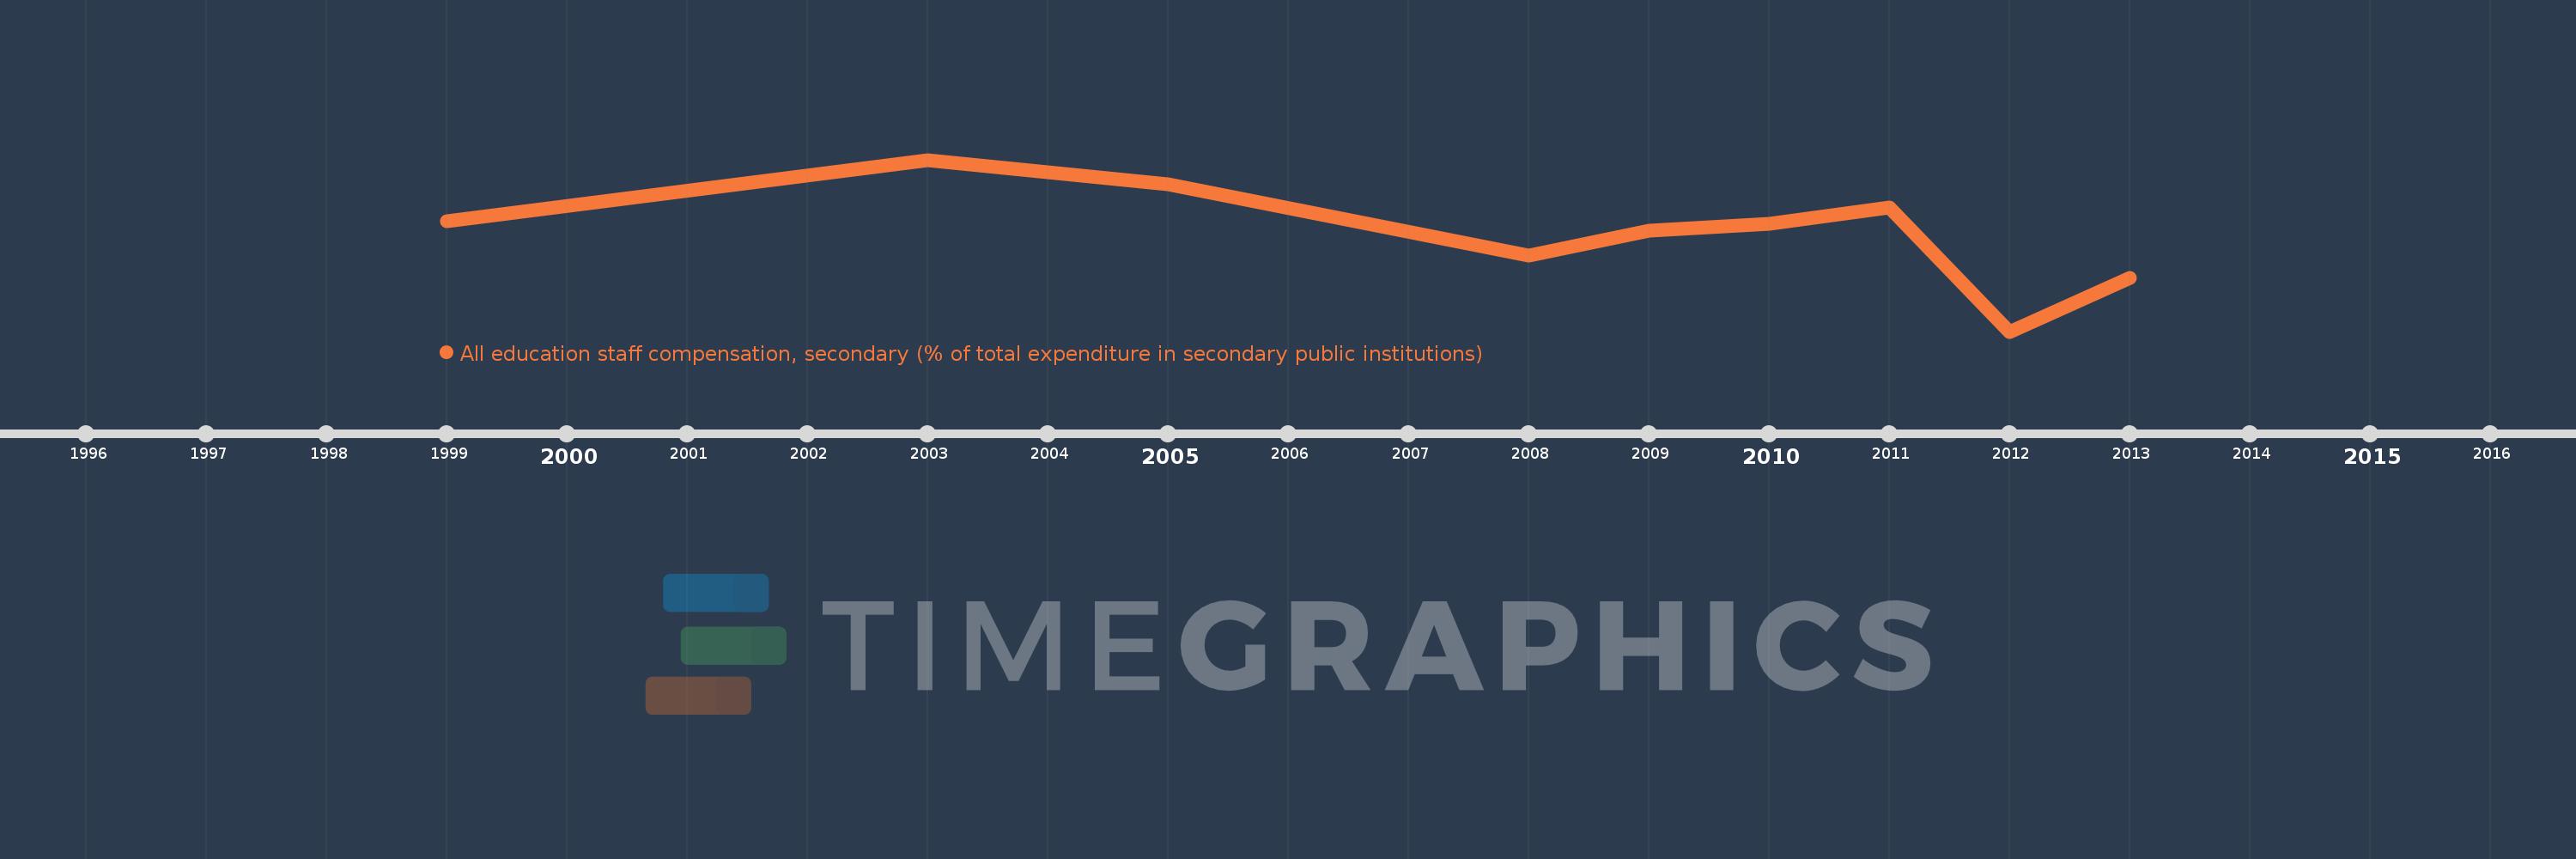
Questa scala temporale mostra un grafico dal 1999 anno al 2013 anno. Malta. I dati fino ad 1998 anno non disponibili. Il numero di osservazioni attuali secondo i date: 9.
La fonte (nome):
Indicatori dello sviluppo mondiale
La fonte (organizzazione):
United Nations Educational, Scientific, and Cultural Organization (UNESCO) Institute for Statistics.
Categorie:
Education
sono stati aggiornati
23 apr 2017 anni
Indicatori delle variazioni dei valori per anni
In media:
75.117
Minima:
58.847
1 gen 2012 anni
Massimo:
87.031
1 gen 2003 anni
Alla data di osservazione
Valore
Variazione assoluta
La variazione rispetto al valore precedente
1 gen 1999 anni
76.963
+76.963
0.0%
1 gen 2003 anni
87.031
+10.068
13.08%
1 gen 2005 anni
82.947
-4.083
-4.69%
1 gen 2008 anni
71.365
-11.583
-13.96%
1 gen 2009 anni
75.466
+4.101
5.75%
1 gen 2010 anni
76.57
+1.104
1.46%
1 gen 2011 anni
79.158
+2.588
3.38%
1 gen 2012 anni
58.847
-20.311
-25.66%
1 gen 2013 anni
67.705
+8.859
15.05%
Classificazione dei paesi secondo i statistiche attuali per anni