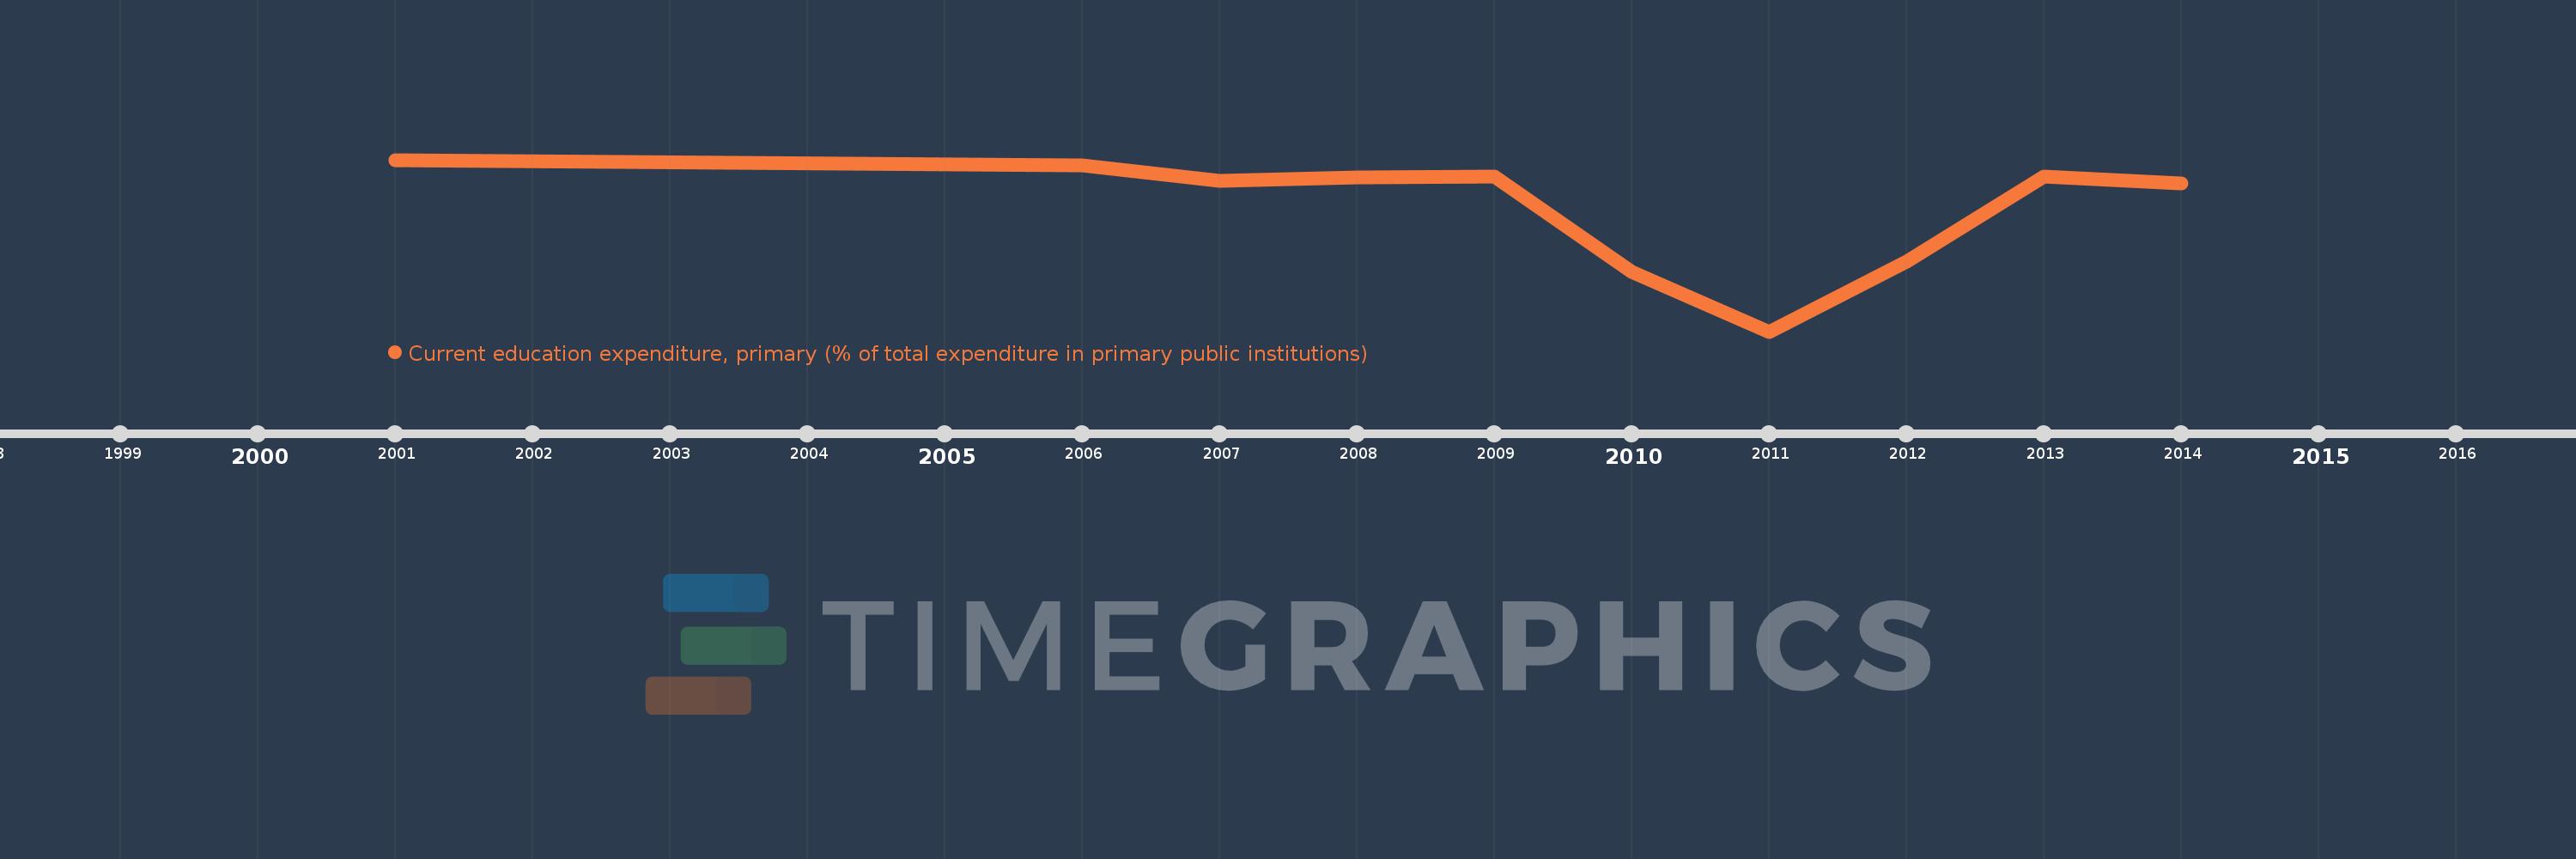
Questa scala temporale mostra un grafico dal 2001 anno al 2014 anno. Australia. I dati fino ad 2000 anno non disponibili. Il numero di osservazioni attuali secondo i date: 10.
La fonte (nome):
Indicatori dello sviluppo mondiale
La fonte (organizzazione):
United Nations Educational, Scientific, and Cultural Organization (UNESCO) Institute for Statistics.
Categorie:
Education
sono stati aggiornati
23 apr 2017 anni
Indicatori delle variazioni dei valori per anni
In media:
88.574
Minima:
73.379
1 gen 2011 anni
Massimo:
94.579
1 gen 2001 anni
Alla data di osservazione
Valore
Variazione assoluta
La variazione rispetto al valore precedente
1 gen 2001 anni
94.579
+94.579
0.0%
1 gen 2006 anni
93.915
-0.665
-0.7%
1 gen 2007 anni
91.939
-1.976
-2.1%
1 gen 2008 anni
92.423
+0.484
0.53%
1 gen 2009 anni
92.52
+0.098
0.11%
1 gen 2010 anni
80.754
-11.766
-12.72%
1 gen 2011 anni
73.379
-7.376
-9.13%
1 gen 2012 anni
82.069
+8.69
11.84%
1 gen 2013 anni
92.537
+10.468
12.76%
1 gen 2014 anni
91.623
-0.914
-0.99%
Classificazione dei paesi secondo i statistiche attuali per anni