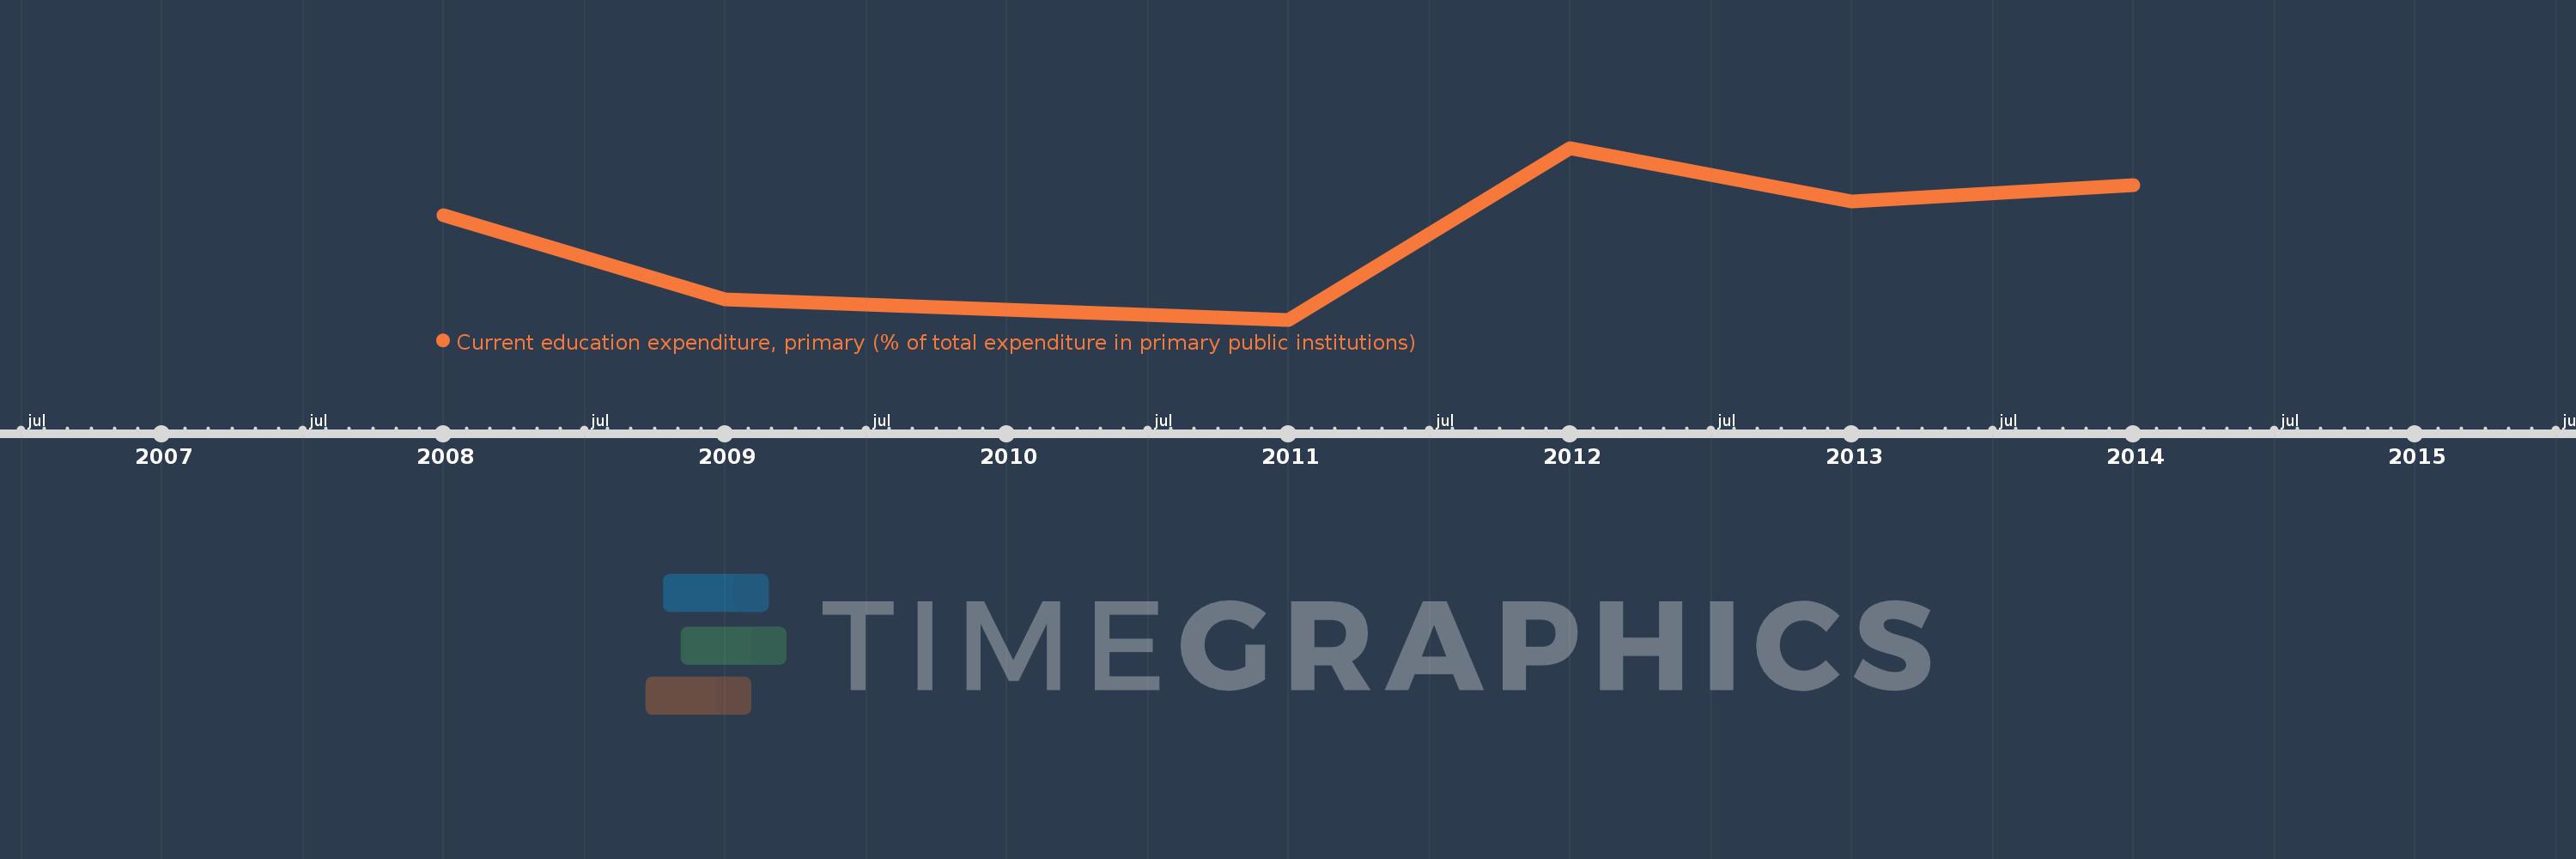
Questa scala temporale mostra un grafico dal 2008 anno al 2014 anno. Rwanda. I dati fino ad 2007 anno non disponibili. Il numero di osservazioni attuali secondo i date: 6.
La fonte (nome):
Indicatori dello sviluppo mondiale
La fonte (organizzazione):
United Nations Educational, Scientific, and Cultural Organization (UNESCO) Institute for Statistics.
Categorie:
Education
sono stati aggiornati
23 apr 2017 anni
Indicatori delle variazioni dei valori per anni
In media:
91.347
Minima:
82.47
1 gen 2011 anni
Massimo:
99.142
1 gen 2012 anni
Alla data di osservazione
Valore
Variazione assoluta
La variazione rispetto al valore precedente
1 gen 2008 anni
92.58
+92.58
0.0%
1 gen 2009 anni
84.455
-8.124
-8.78%
1 gen 2011 anni
82.47
-1.985
-2.35%
1 gen 2012 anni
99.142
+16.671
20.21%
1 gen 2013 anni
93.943
-5.198
-5.24%
1 gen 2014 anni
95.494
+1.551
1.65%
Classificazione dei paesi secondo i statistiche attuali per anni