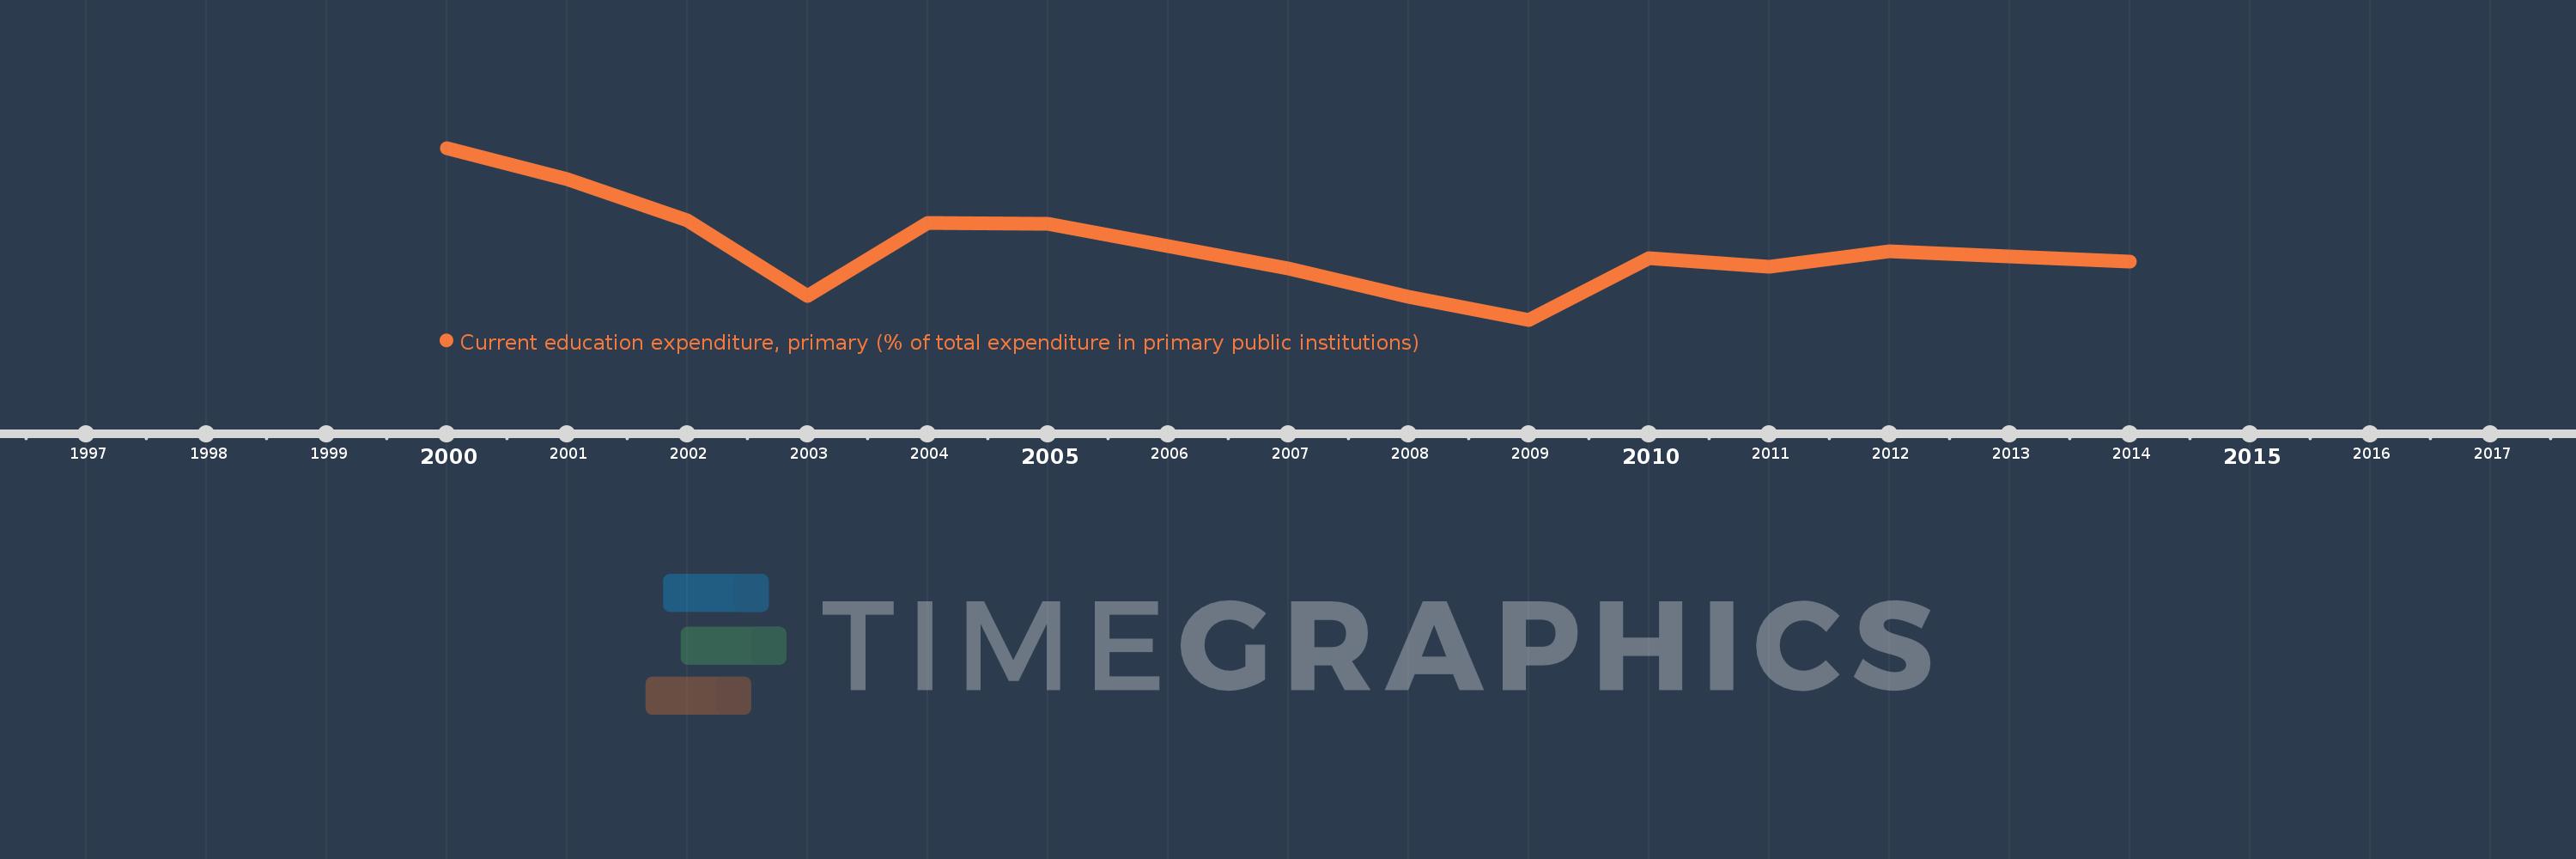
Questa scala temporale mostra un grafico dal 2000 anno al 2014 anno. Latvia. I dati fino ad 1999 anno non disponibili. Il numero di osservazioni attuali secondo i date: 13.
La fonte (nome):
Indicatori dello sviluppo mondiale
La fonte (organizzazione):
United Nations Educational, Scientific, and Cultural Organization (UNESCO) Institute for Statistics.
Categorie:
Education
sono stati aggiornati
23 apr 2017 anni
Indicatori delle variazioni dei valori per anni
In media:
87.981
Minima:
81.824
1 gen 2009 anni
Massimo:
96.383
1 gen 2000 anni
Alla data di osservazione
Valore
Variazione assoluta
La variazione rispetto al valore precedente
1 gen 2000 anni
96.383
+96.383
0.0%
1 gen 2001 anni
93.762
-2.621
-2.72%
1 gen 2002 anni
90.24
-3.522
-3.76%
1 gen 2003 anni
83.871
-6.369
-7.06%
1 gen 2004 anni
90.051
+6.18
7.37%
1 gen 2005 anni
89.967
-0.083
-0.09%
1 gen 2007 anni
86.156
-3.811
-4.24%
1 gen 2008 anni
83.74
-2.416
-2.8%
1 gen 2009 anni
81.824
-1.916
-2.29%
1 gen 2010 anni
87.064
+5.24
6.4%
1 gen 2011 anni
86.297
-0.768
-0.88%
1 gen 2012 anni
87.66
+1.364
1.58%
1 gen 2014 anni
86.744
-0.916
-1.05%
Classificazione dei paesi secondo i statistiche attuali per anni