Questa scala temporale mostra un grafico dal 2000 anno al 2013 anno. Euro area. I dati fino ad 1999 anno non disponibili. Il numero di osservazioni attuali secondo i date: 14.
La fonte (nome):
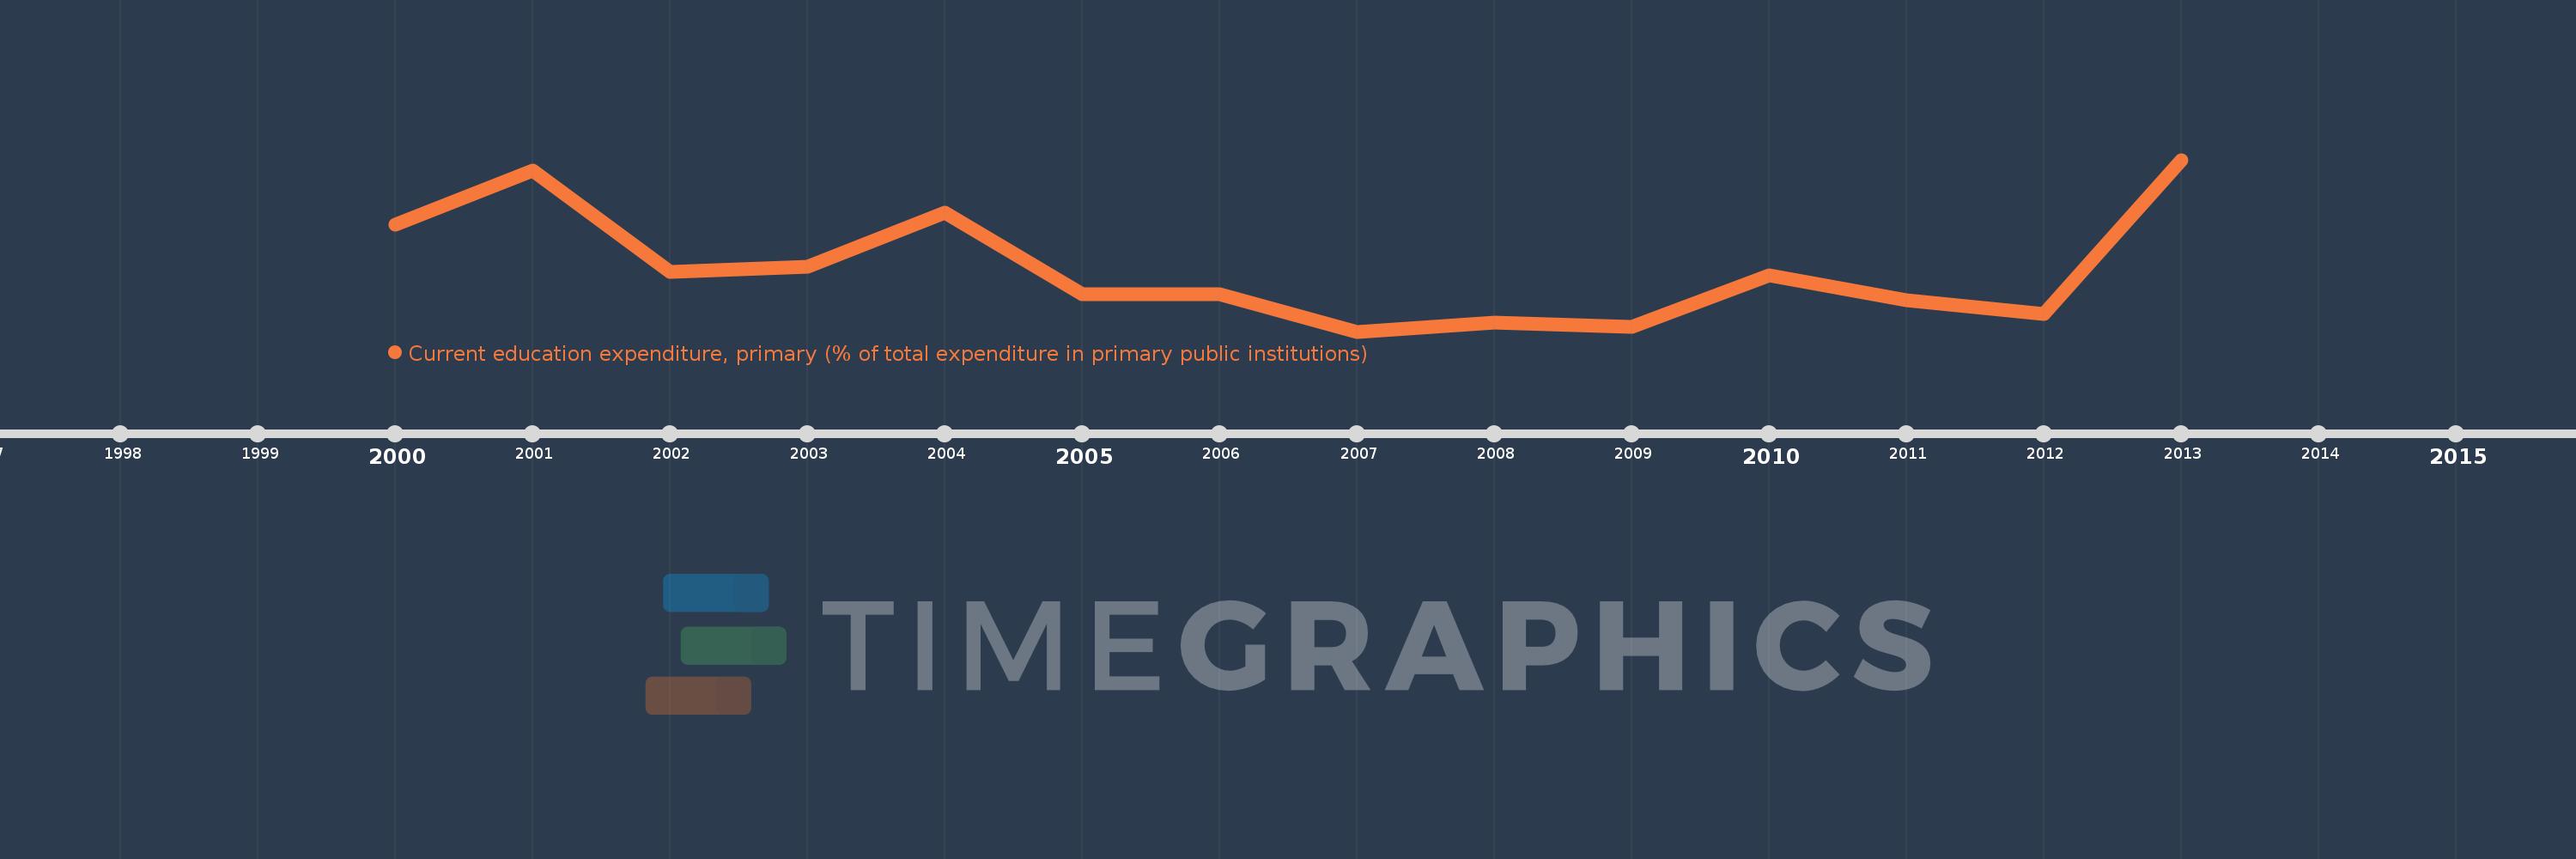
Indicatori dello sviluppo mondiale
La fonte (organizzazione):
United Nations Educational, Scientific, and Cultural Organization (UNESCO) Institute for Statistics.
Categorie:
Education
sono stati aggiornati
23 apr 2017 anni
Indicatori delle variazioni dei valori per anni
In media:
92.593
Minima:
91.703
1 gen 2007 anni
Massimo:
94.141
1 gen 2013 anni
Alla data di osservazione
Valore
Variazione assoluta
La variazione rispetto al valore precedente
1 gen 2000 anni
93.226
+93.226
0.0%
1 gen 2001 anni
93.987
+0.76
0.82%
1 gen 2002 anni
92.551
-1.436
-1.53%
1 gen 2003 anni
92.619
+0.068
0.07%
1 gen 2004 anni
93.395
+0.776
0.84%
1 gen 2005 anni
92.234
-1.162
-1.24%
1 gen 2006 anni
92.236
+0.002
0.0%
1 gen 2007 anni
91.703
-0.532
-0.58%
1 gen 2008 anni
91.83
+0.127
0.14%
1 gen 2009 anni
91.774
-0.057
-0.06%
1 gen 2010 anni
92.497
+0.723
0.79%
1 gen 2011 anni
92.152
-0.345
-0.37%
1 gen 2012 anni
91.955
-0.197
-0.21%
1 gen 2013 anni
94.141
+2.185
2.38%
Classificazione dei paesi secondo i statistiche attuali per anni