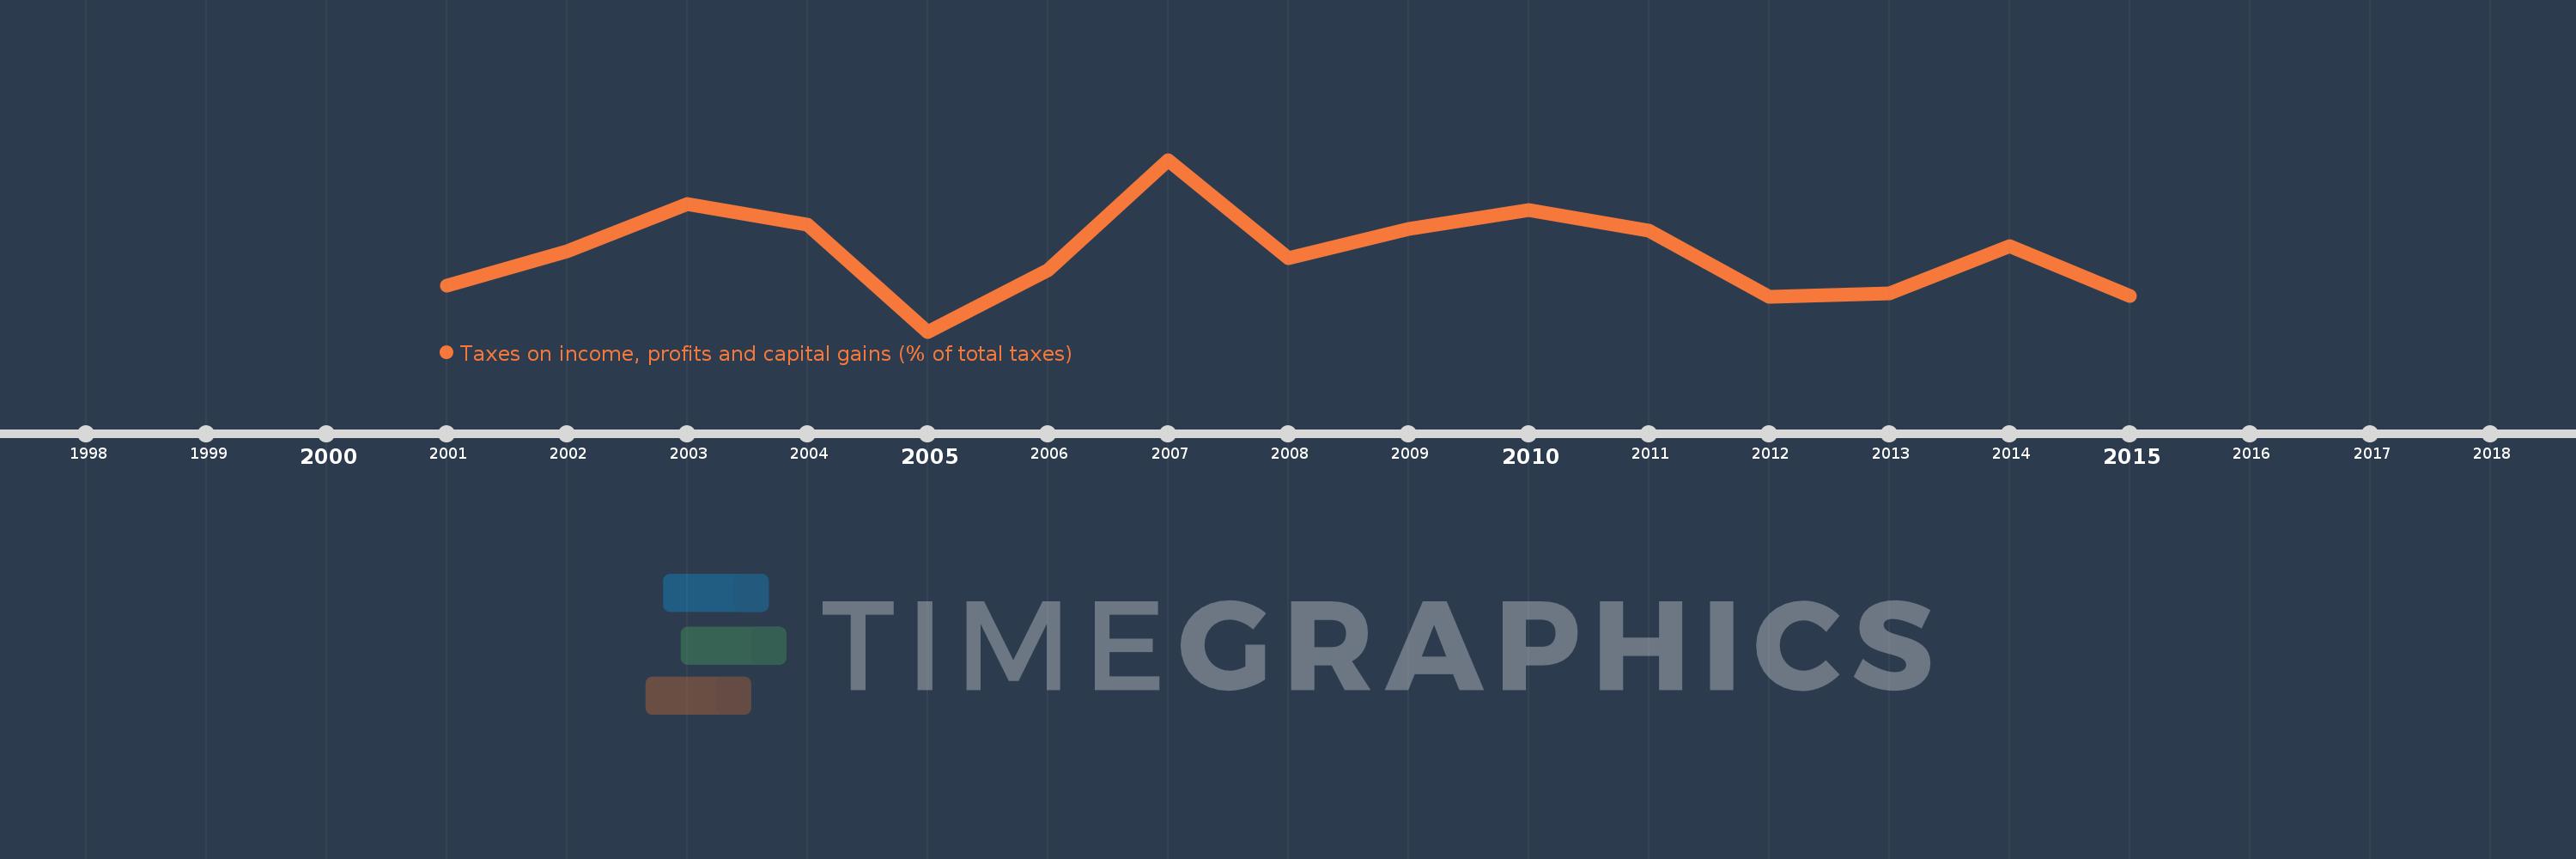
Questa scala temporale mostra un grafico dal 2001 anno al 2015 anno. Antigua and Barbuda. I dati fino ad 2000 anno non disponibili. Il numero di osservazioni attuali secondo i date: 15.
La fonte (nome):
Indicatori dello sviluppo mondiale
La fonte (organizzazione):
International Monetary Fund, Government Finance Statistics Yearbook and data files.
Categorie:
Public Sector
sono stati aggiornati
23 apr 2017 anni
Indicatori delle variazioni dei valori per anni
In media:
14.911
Minima:
10.859
1 gen 2005 anni
Massimo:
19.645
1 gen 2007 anni
Alla data di osservazione
Valore
Variazione assoluta
La variazione rispetto al valore precedente
1 gen 2001 anni
13.215
+13.215
0.0%
1 gen 2002 anni
14.97
+1.755
13.28%
1 gen 2003 anni
17.392
+2.422
16.18%
1 gen 2004 anni
16.341
-1.05
-6.04%
1 gen 2005 anni
10.859
-5.482
-33.55%
1 gen 2006 anni
14.018
+3.159
29.09%
1 gen 2007 anni
19.645
+5.627
40.14%
1 gen 2008 anni
14.609
-5.036
-25.64%
1 gen 2009 anni
16.098
+1.489
10.19%
1 gen 2010 anni
17.094
+0.996
6.18%
1 gen 2011 anni
16.036
-1.058
-6.19%
1 gen 2012 anni
12.636
-3.4
-21.2%
1 gen 2013 anni
12.797
+0.161
1.28%
1 gen 2014 anni
15.252
+2.456
19.19%
1 gen 2015 anni
12.698
-2.555
-16.75%
Classificazione dei paesi secondo i statistiche attuali per anni