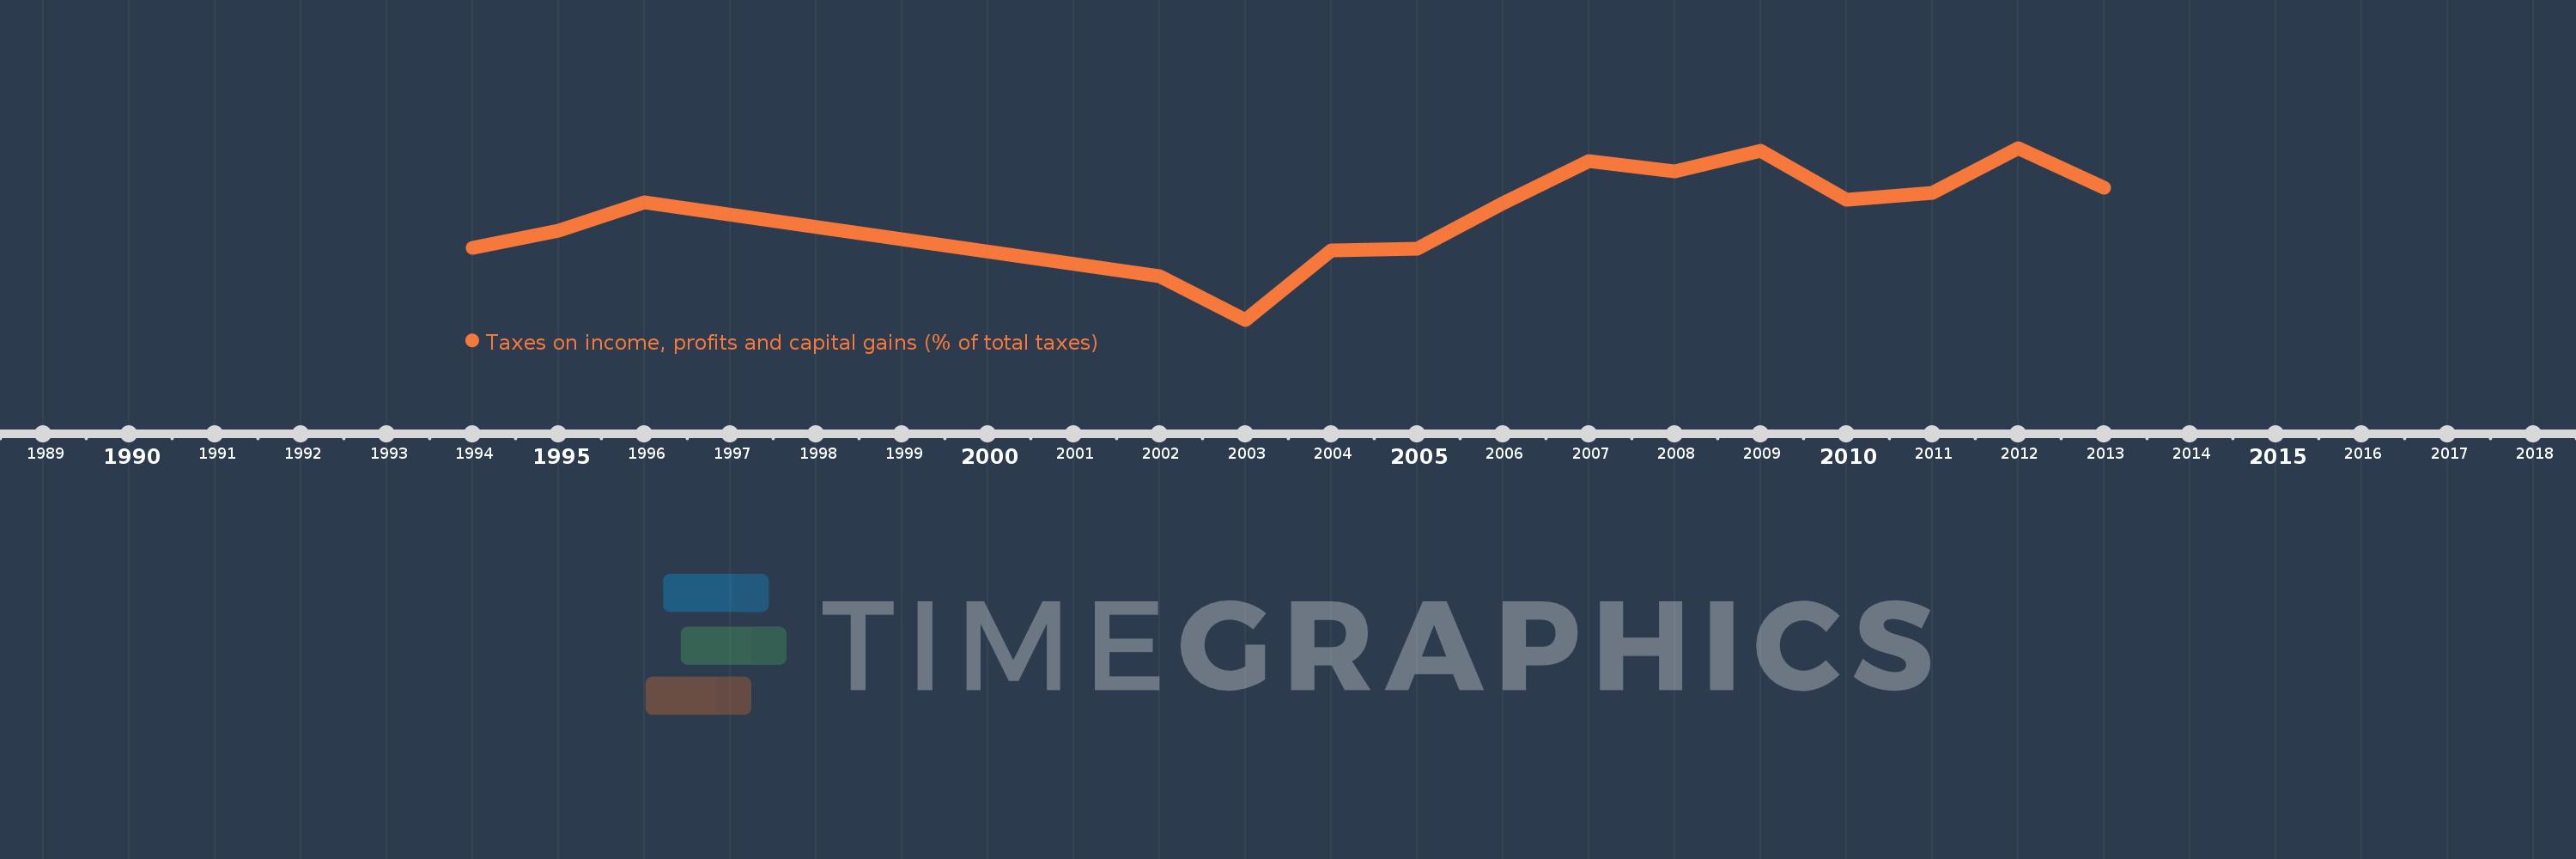
Questa scala temporale mostra un grafico dal 1994 anno al 2013 anno. Trinidad and Tobago. I dati fino ad 1993 anno non disponibili. Il numero di osservazioni attuali secondo i date: 15.
La fonte (nome):
Indicatori dello sviluppo mondiale
La fonte (organizzazione):
International Monetary Fund, Government Finance Statistics Yearbook and data files.
Categorie:
Public Sector
sono stati aggiornati
23 apr 2017 anni
Indicatori delle variazioni dei valori per anni
In media:
57.851
Minima:
33.963
1 gen 2003 anni
Massimo:
72.309
1 gen 2012 anni
Alla data di osservazione
Valore
Variazione assoluta
La variazione rispetto al valore precedente
1 gen 1994 anni
50.011
+50.011
0.0%
1 gen 1995 anni
53.827
+3.815
7.63%
1 gen 1996 anni
60.201
+6.374
11.84%
1 gen 2002 anni
43.742
-16.458
-27.34%
1 gen 2003 anni
33.963
-9.78
-22.36%
1 gen 2004 anni
49.405
+15.443
45.47%
1 gen 2005 anni
49.771
+0.366
0.74%
1 gen 2006 anni
60.013
+10.241
20.58%
1 gen 2007 anni
69.29
+9.277
15.46%
1 gen 2008 anni
67.104
-2.185
-3.15%
1 gen 2009 anni
71.683
+4.579
6.82%
1 gen 2010 anni
60.702
-10.981
-15.32%
1 gen 2011 anni
62.229
+1.527
2.51%
1 gen 2012 anni
72.309
+10.08
16.2%
1 gen 2013 anni
63.51
-8.799
-12.17%
Classificazione dei paesi secondo i statistiche attuali per anni