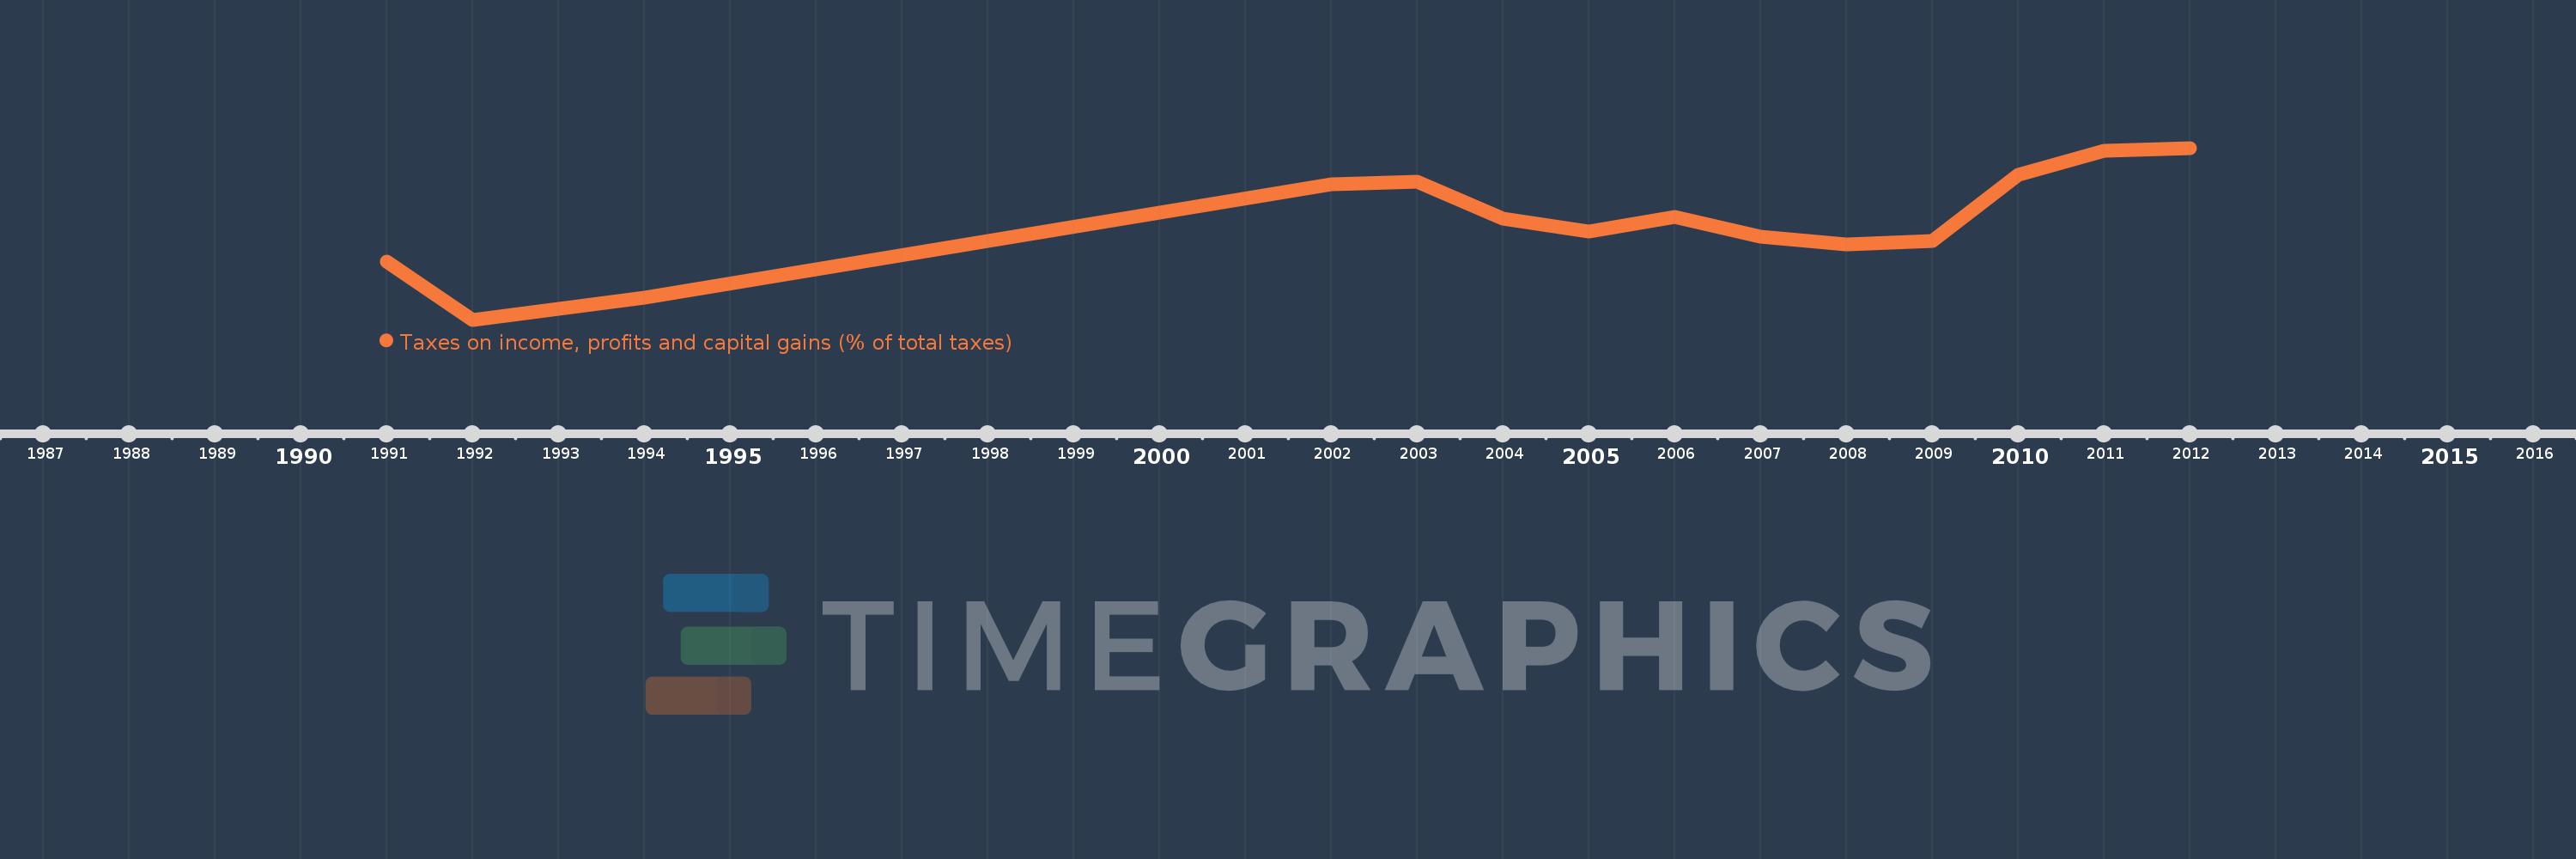
Questa scala temporale mostra un grafico dal 1991 anno al 2012 anno. Ghana. I dati fino ad 1990 anno non disponibili. Il numero di osservazioni attuali secondo i date: 15.
La fonte (nome):
Indicatori dello sviluppo mondiale
La fonte (organizzazione):
International Monetary Fund, Government Finance Statistics Yearbook and data files.
Categorie:
Public Sector
sono stati aggiornati
23 apr 2017 anni
Indicatori delle variazioni dei valori per anni
In media:
28.307
Minima:
19.547
1 gen 1992 anni
Massimo:
35.905
1 gen 2012 anni
Alla data di osservazione
Valore
Variazione assoluta
La variazione rispetto al valore precedente
1 gen 1991 anni
25.102
+25.102
0.0%
1 gen 1992 anni
19.547
-5.555
-22.13%
1 gen 1993 anni
20.575
+1.028
5.26%
1 gen 1994 anni
21.663
+1.089
5.29%
1 gen 2002 anni
32.446
+10.783
49.77%
1 gen 2003 anni
32.704
+0.258
0.8%
1 gen 2004 anni
29.187
-3.517
-10.75%
1 gen 2005 anni
27.953
-1.234
-4.23%
1 gen 2006 anni
29.377
+1.424
5.09%
1 gen 2007 anni
27.475
-1.902
-6.48%
1 gen 2008 anni
26.684
-0.791
-2.88%
1 gen 2009 anni
27.059
+0.376
1.41%
1 gen 2010 anni
33.327
+6.267
23.16%
1 gen 2011 anni
35.608
+2.281
6.85%
1 gen 2012 anni
35.905
+0.297
0.84%
Classificazione dei paesi secondo i statistiche attuali per anni