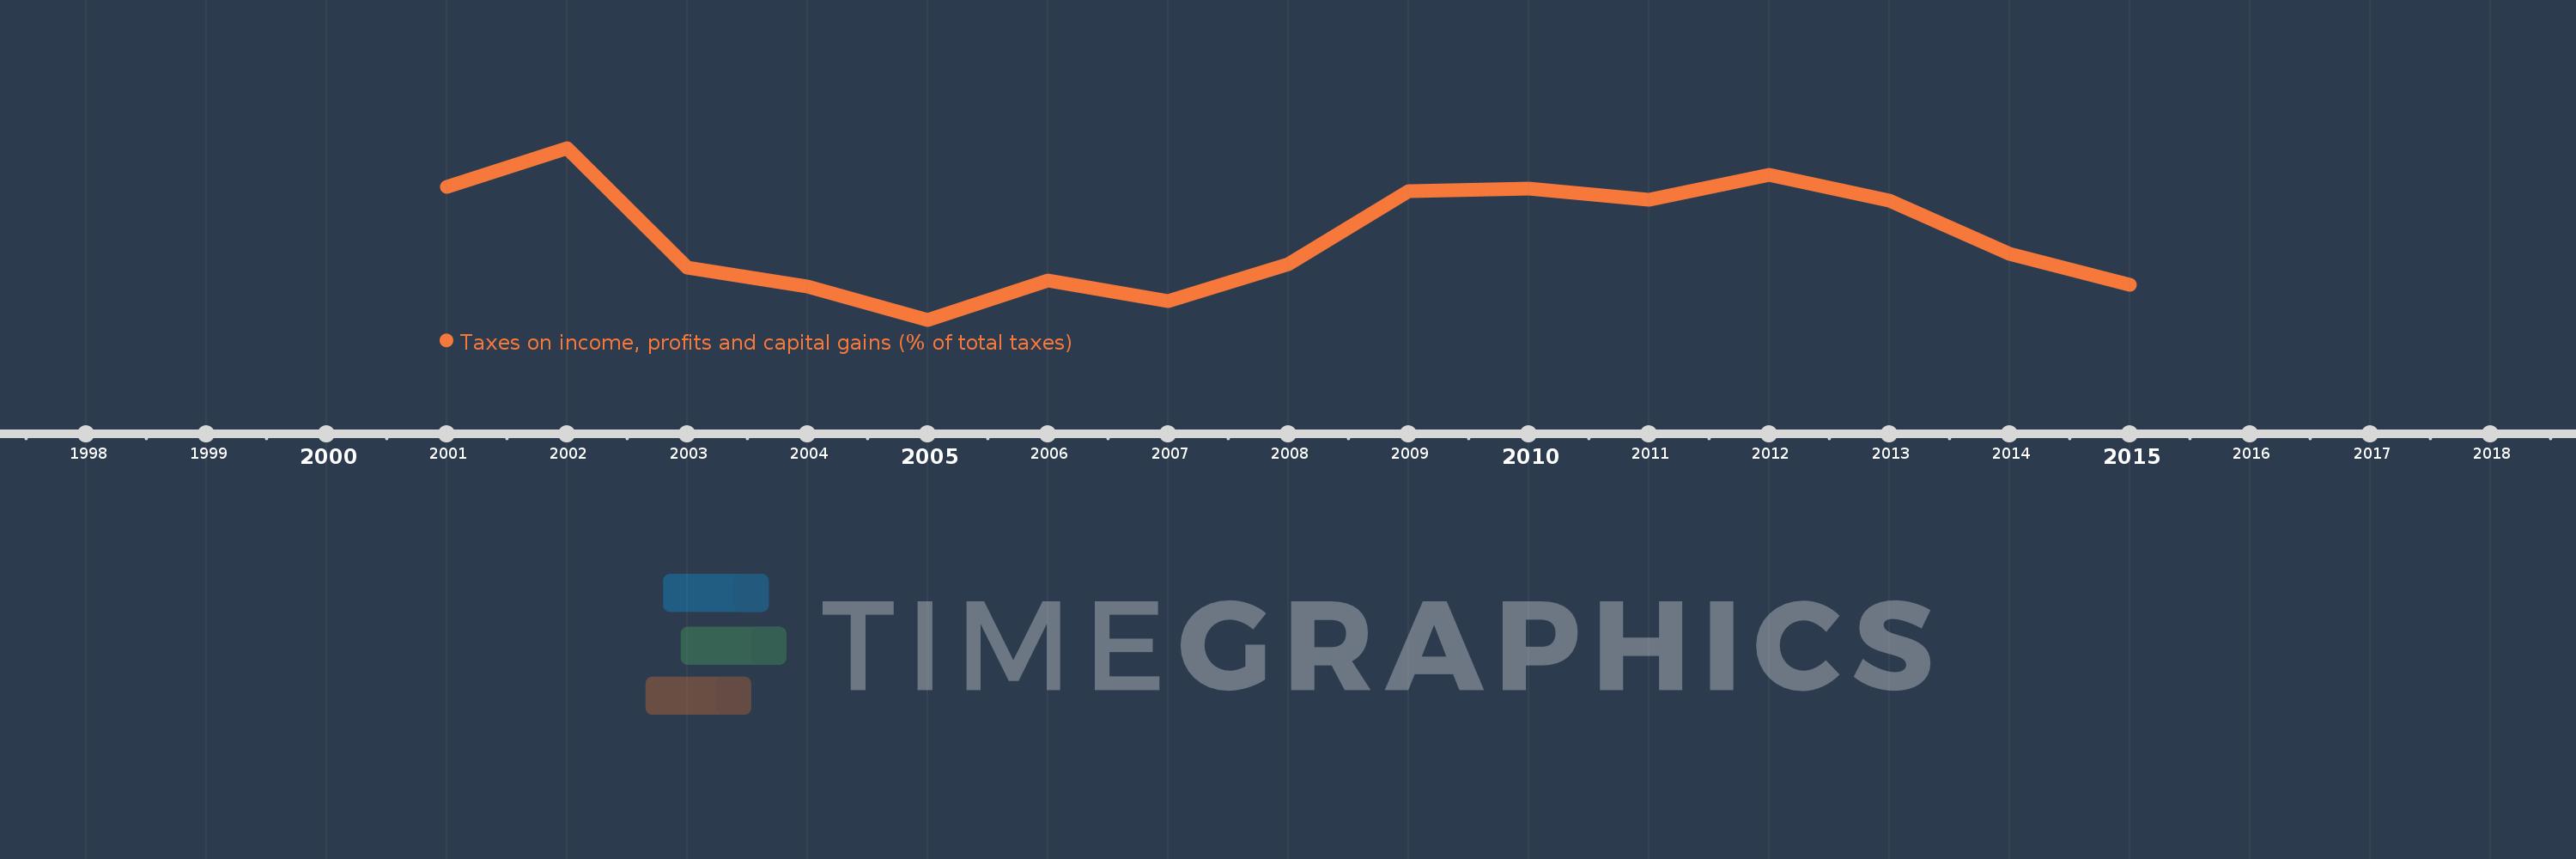
Questa scala temporale mostra un grafico dal 2001 anno al 2015 anno. St. Lucia. I dati fino ad 2000 anno non disponibili. Il numero di osservazioni attuali secondo i date: 15.
La fonte (nome):
Indicatori dello sviluppo mondiale
La fonte (organizzazione):
International Monetary Fund, Government Finance Statistics Yearbook and data files.
Categorie:
Public Sector
sono stati aggiornati
23 apr 2017 anni
Indicatori delle variazioni dei valori per anni
In media:
28.418
Minima:
23.491
1 gen 2005 anni
Massimo:
33.654
1 gen 2002 anni
Alla data di osservazione
Valore
Variazione assoluta
La variazione rispetto al valore precedente
1 gen 2001 anni
31.334
+31.334
0.0%
1 gen 2002 anni
33.654
+2.32
7.4%
1 gen 2003 anni
26.57
-7.084
-21.05%
1 gen 2004 anni
25.455
-1.115
-4.2%
1 gen 2005 anni
23.491
-1.964
-7.71%
1 gen 2006 anni
25.819
+2.328
9.91%
1 gen 2007 anni
24.58
-1.239
-4.8%
1 gen 2008 anni
26.798
+2.217
9.02%
1 gen 2009 anni
31.12
+4.322
16.13%
1 gen 2010 anni
31.249
+0.129
0.42%
1 gen 2011 anni
30.615
-0.634
-2.03%
1 gen 2012 anni
32.077
+1.462
4.77%
1 gen 2013 anni
30.545
-1.532
-4.78%
1 gen 2014 anni
27.393
-3.152
-10.32%
1 gen 2015 anni
25.574
-1.819
-6.64%
Classificazione dei paesi secondo i statistiche attuali per anni