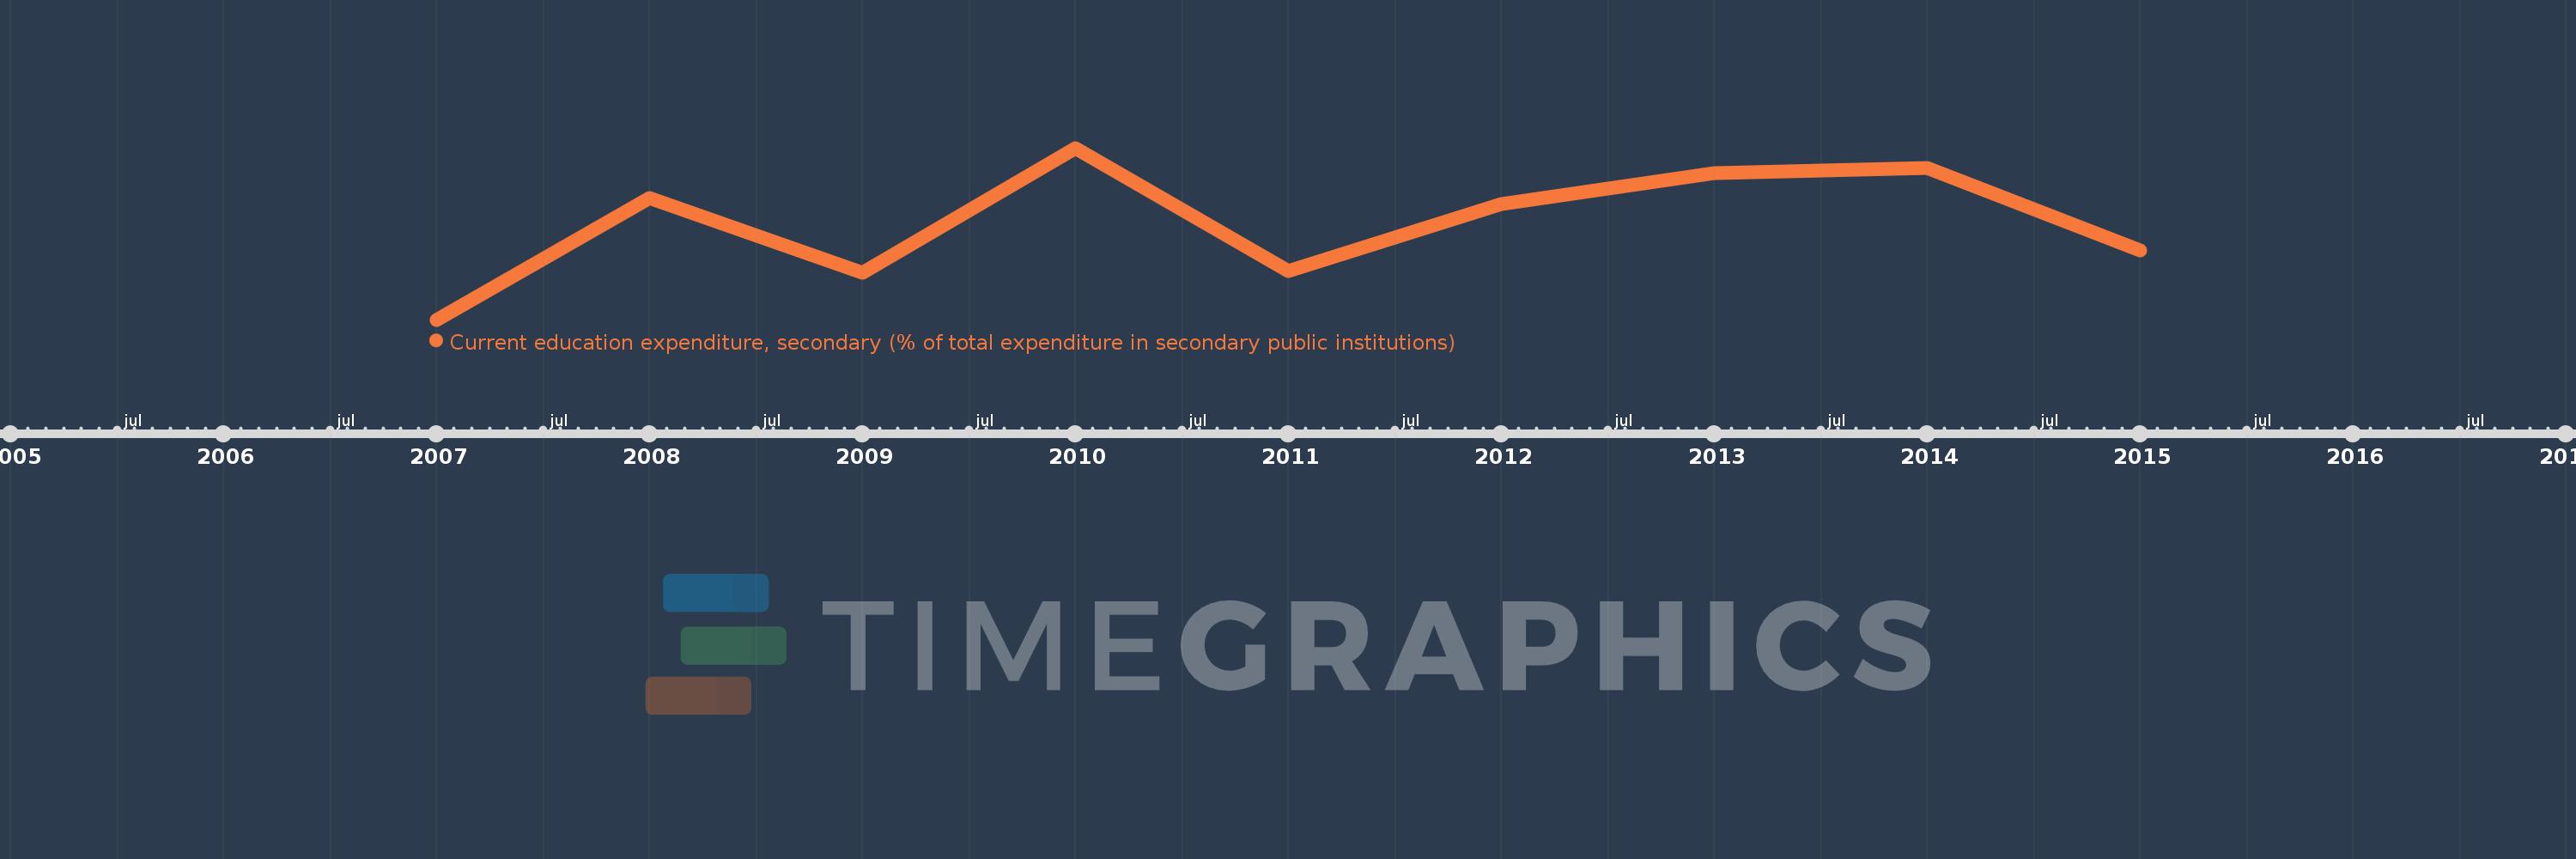
Questa scala temporale mostra un grafico dal 2007 anno al 2015 anno. Andorra. I dati fino ad 2006 anno non disponibili. Il numero di osservazioni attuali secondo i date: 9.
La fonte (nome):
Indicatori dello sviluppo mondiale
La fonte (organizzazione):
United Nations Educational, Scientific, and Cultural Organization (UNESCO) Institute for Statistics.
Categorie:
Education
sono stati aggiornati
23 apr 2017 anni
Indicatori delle variazioni dei valori per anni
In media:
98.291
Minima:
97.26
1 gen 2007 anni
Massimo:
99.089
1 gen 2010 anni
Alla data di osservazione
Valore
Variazione assoluta
La variazione rispetto al valore precedente
1 gen 2007 anni
97.26
+97.26
0.0%
1 gen 2008 anni
98.557
+1.296
1.33%
1 gen 2009 anni
97.756
-0.8
-0.81%
1 gen 2010 anni
99.089
+1.333
1.36%
1 gen 2011 anni
97.776
-1.313
-1.33%
1 gen 2012 anni
98.493
+0.717
0.73%
1 gen 2013 anni
98.82
+0.327
0.33%
1 gen 2014 anni
98.876
+0.056
0.06%
1 gen 2015 anni
97.996
-0.88
-0.89%
Classificazione dei paesi secondo i statistiche attuali per anni