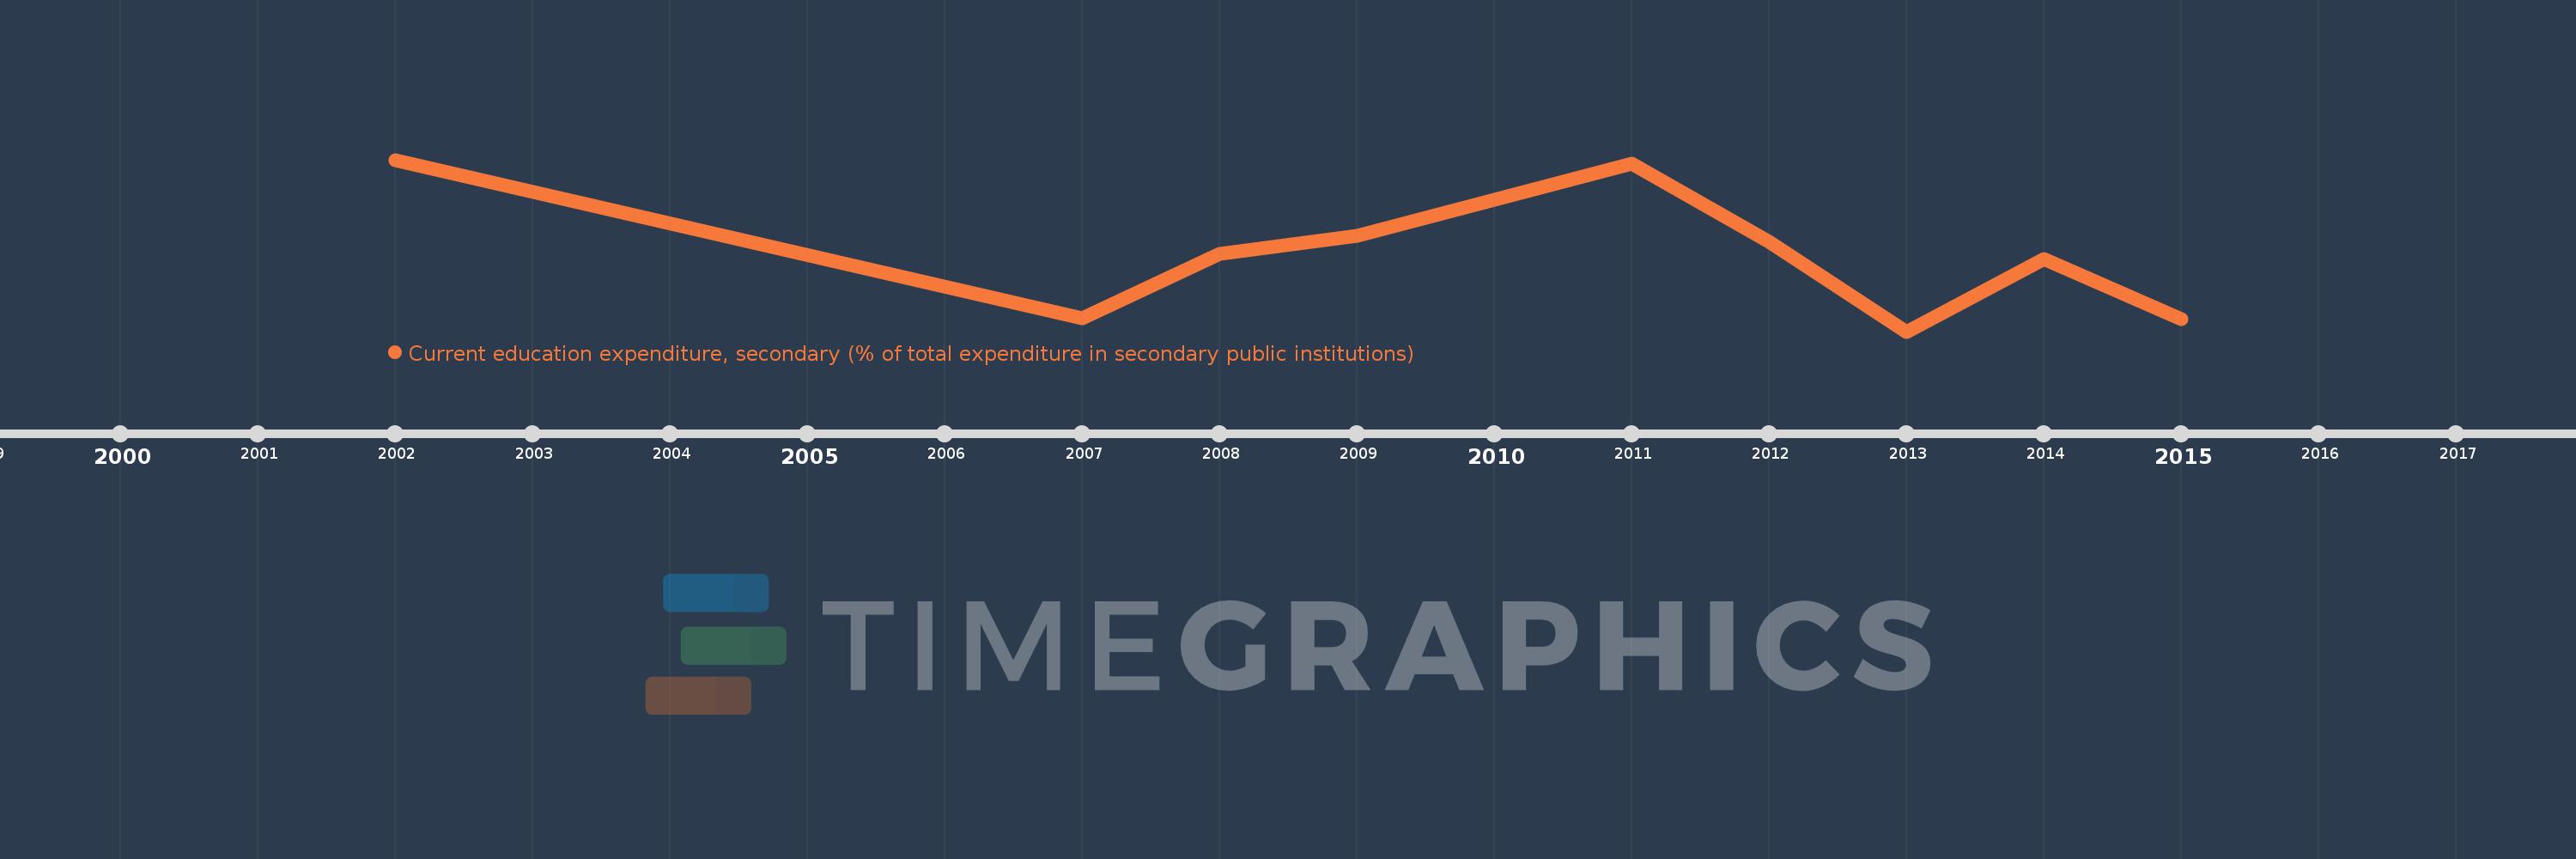
Questa scala temporale mostra un grafico dal 2002 anno al 2015 anno. Guatemala. I dati fino ad 2001 anno non disponibili. Il numero di osservazioni attuali secondo i date: 9.
La fonte (nome):
Indicatori dello sviluppo mondiale
La fonte (organizzazione):
United Nations Educational, Scientific, and Cultural Organization (UNESCO) Institute for Statistics.
Categorie:
Education
sono stati aggiornati
23 apr 2017 anni
Indicatori delle variazioni dei valori per anni
In media:
95.506
Minima:
91.774
1 gen 2013 anni
Massimo:
100.0
1 gen 2002 anni
Alla data di osservazione
Valore
Variazione assoluta
La variazione rispetto al valore precedente
1 gen 2002 anni
100.0
+100.0
0.0%
1 gen 2007 anni
92.414
-7.586
-7.59%
1 gen 2008 anni
95.497
+3.083
3.34%
1 gen 2009 anni
96.376
+0.879
0.92%
1 gen 2011 anni
99.816
+3.44
3.57%
1 gen 2012 anni
96.07
-3.746
-3.75%
1 gen 2013 anni
91.774
-4.297
-4.47%
1 gen 2014 anni
95.246
+3.473
3.78%
1 gen 2015 anni
92.361
-2.885
-3.03%
Classificazione dei paesi secondo i statistiche attuali per anni