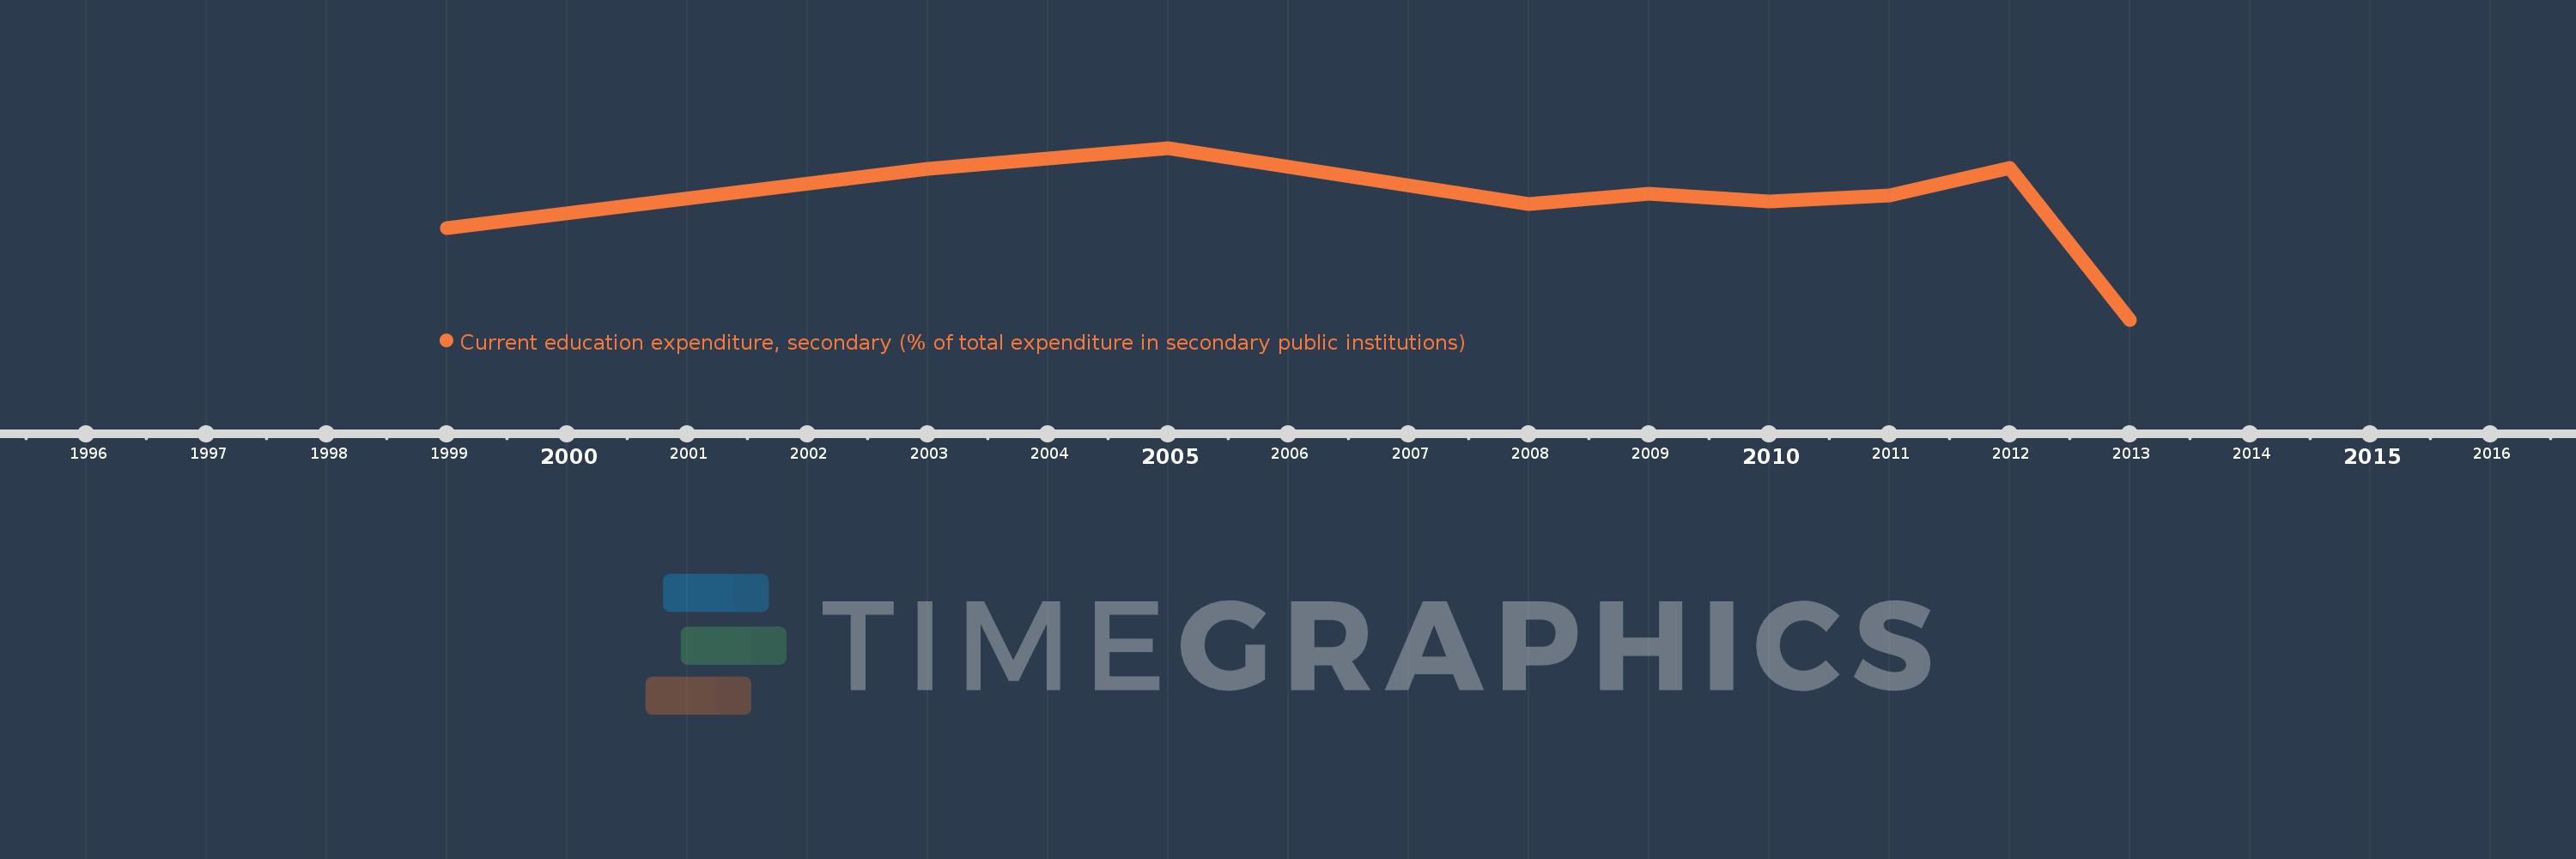
Questa scala temporale mostra un grafico dal 1999 anno al 2013 anno. Malta. I dati fino ad 1998 anno non disponibili. Il numero di osservazioni attuali secondo i date: 9.
La fonte (nome):
Indicatori dello sviluppo mondiale
La fonte (organizzazione):
United Nations Educational, Scientific, and Cultural Organization (UNESCO) Institute for Statistics.
Categorie:
Education
sono stati aggiornati
23 apr 2017 anni
Indicatori delle variazioni dei valori per anni
In media:
91.414
Minima:
75.006
1 gen 2013 anni
Massimo:
99.165
1 gen 2005 anni
Alla data di osservazione
Valore
Variazione assoluta
La variazione rispetto al valore precedente
1 gen 1999 anni
87.859
+87.859
0.0%
1 gen 2003 anni
96.23
+8.371
9.53%
1 gen 2005 anni
99.165
+2.935
3.05%
1 gen 2008 anni
91.287
-7.878
-7.94%
1 gen 2009 anni
92.764
+1.477
1.62%
1 gen 2010 anni
91.653
-1.111
-1.2%
1 gen 2011 anni
92.441
+0.788
0.86%
1 gen 2012 anni
96.321
+3.88
4.2%
1 gen 2013 anni
75.006
-21.314
-22.13%
Classificazione dei paesi secondo i statistiche attuali per anni