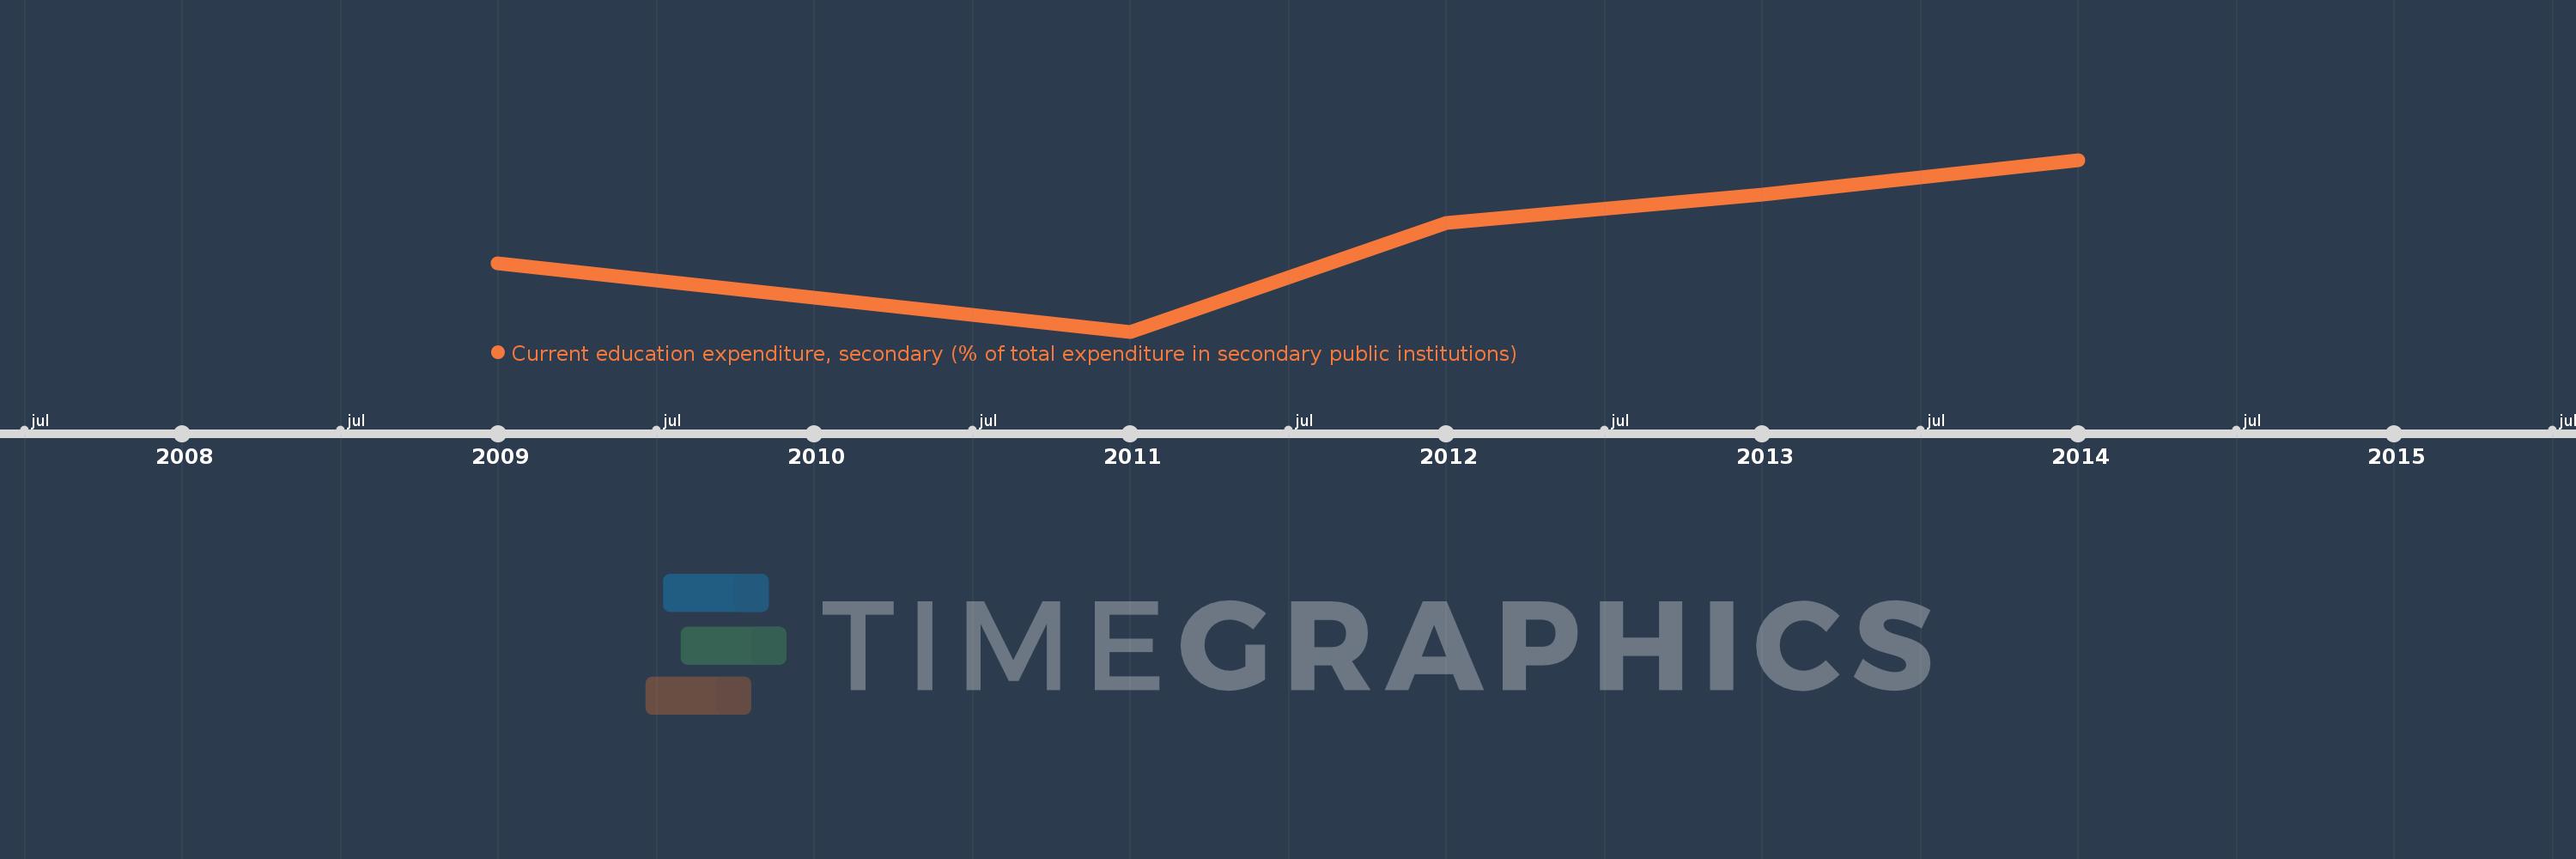
Questa scala temporale mostra un grafico dal 2009 anno al 2014 anno. Singapore. I dati fino ad 2008 anno non disponibili. Il numero di osservazioni attuali secondo i date: 6.
La fonte (nome):
Indicatori dello sviluppo mondiale
La fonte (organizzazione):
United Nations Educational, Scientific, and Cultural Organization (UNESCO) Institute for Statistics.
Categorie:
Education
sono stati aggiornati
23 apr 2017 anni
Indicatori delle variazioni dei valori per anni
In media:
92.19
Minima:
87.753
1 gen 2011 anni
Massimo:
96.566
1 gen 2014 anni
Alla data di osservazione
Valore
Variazione assoluta
La variazione rispetto al valore precedente
1 gen 2009 anni
91.244
+91.244
0.0%
1 gen 2010 anni
89.492
-1.752
-1.92%
1 gen 2011 anni
87.753
-1.738
-1.94%
1 gen 2012 anni
93.311
+5.558
6.33%
1 gen 2013 anni
94.778
+1.467
1.57%
1 gen 2014 anni
96.566
+1.788
1.89%
Classificazione dei paesi secondo i statistiche attuali per anni