33
/it/
AIzaSyAYiBZKx7MnpbEhh9jyipgxe19OcubqV5w
August 1, 2025
65123
Albania
ALB
true
2
1
Net official flows from UN agencies, IFAD (current US$)
2015,2014,2013,2012,2011,2010,2009,2008,2007,2006,2005,2004,2003,2002,2001,2000,1999,1998,1997,1996,1995
Download
Biblioteca di statistiche globali →Albania →

Net official flows from UN agencies, IFAD (current US$)

Queste statistiche in altri paesi:

AfghanistanAlbaniaAlgeriaAngolaArab WorldArgentinaArmeniaAzerbaijanBangladeshBelizeBeninBhutanBoliviaBosnia and HerzegovinaBotswanaBrazilBurkina FasoBurundiCabo VerdeCambodiaCameroonCaribbean small statesCentral African RepublicCentral Europe and the BalticsChadChileChinaColombiaComorosCongo, Dem. Rep.Congo, Rep.Costa RicaCote d'IvoireCubaCyprusDjiboutiDominicaDominican RepublicEast Asia & PacificEast Asia & Pacific (excluding high income)East Asia & Pacific (IDA & IBRD countries)EcuadorEgypt, Arab Rep.El SalvadorEquatorial GuineaEritreaEthiopiaEuro areaEurope & Central AsiaEurope & Central Asia (excluding high income)Europe & Central Asia (IDA & IBRD countries)European UnionFragile and conflict affected situationsGabonGambia, TheGeorgiaGhanaGrenadaGuatemalaGuineaGuinea-BissauGuyanaHaitiHeavily indebted poor countries (HIPC)High incomeHondurasIBRD onlyIDA & IBRD totalIDA blendIDA onlyIDA totalIndiaIndonesiaIraqJamaicaJordanKenyaKorea, Dem. People’s Rep.Kyrgyz RepublicLao PDRLatin America & Caribbean Latin America & Caribbean (excluding high income)Latin America & the Caribbean (IDA & IBRD countries)Least developed countries: UN classificationLebanonLesothoLiberiaLow incomeLower middle incomeMacao SAR, ChinaMacedonia, FYRMadagascarMalawiMaldivesMaliMauritaniaMauritiusMexicoMiddle East & North AfricaMiddle East & North Africa (excluding high income)Middle East & North Africa (IDA & IBRD countries)MoldovaMongoliaMoroccoMozambiqueMyanmarNamibiaNepalNicaraguaNigerNigeriaOECD membersOther small statesPacific island small statesPakistanPanamaPapua New GuineaParaguayPeruPhilippinesRomaniaRwandaSamoaSao Tome and PrincipeSenegalSeychellesSierra LeoneSmall statesSolomon IslandsSomaliaSouth AsiaSouth Asia (IDA & IBRD)South SudanSri LankaSt. LuciaSt. Vincent and the GrenadinesSub-Saharan Africa Sub-Saharan Africa (excluding high income)Sub-Saharan Africa (IDA & IBRD countries)SudanSurinameSwazilandSyrian Arab RepublicTajikistanTanzaniaThailandTimor-LesteTogoTongaTunisiaTurkeyUgandaUpper middle incomeUruguayUzbekistanVenezuela, RBVietnamWest Bank and GazaWorldYemen, Rep.ZambiaZimbabwe

Linea del tempo:

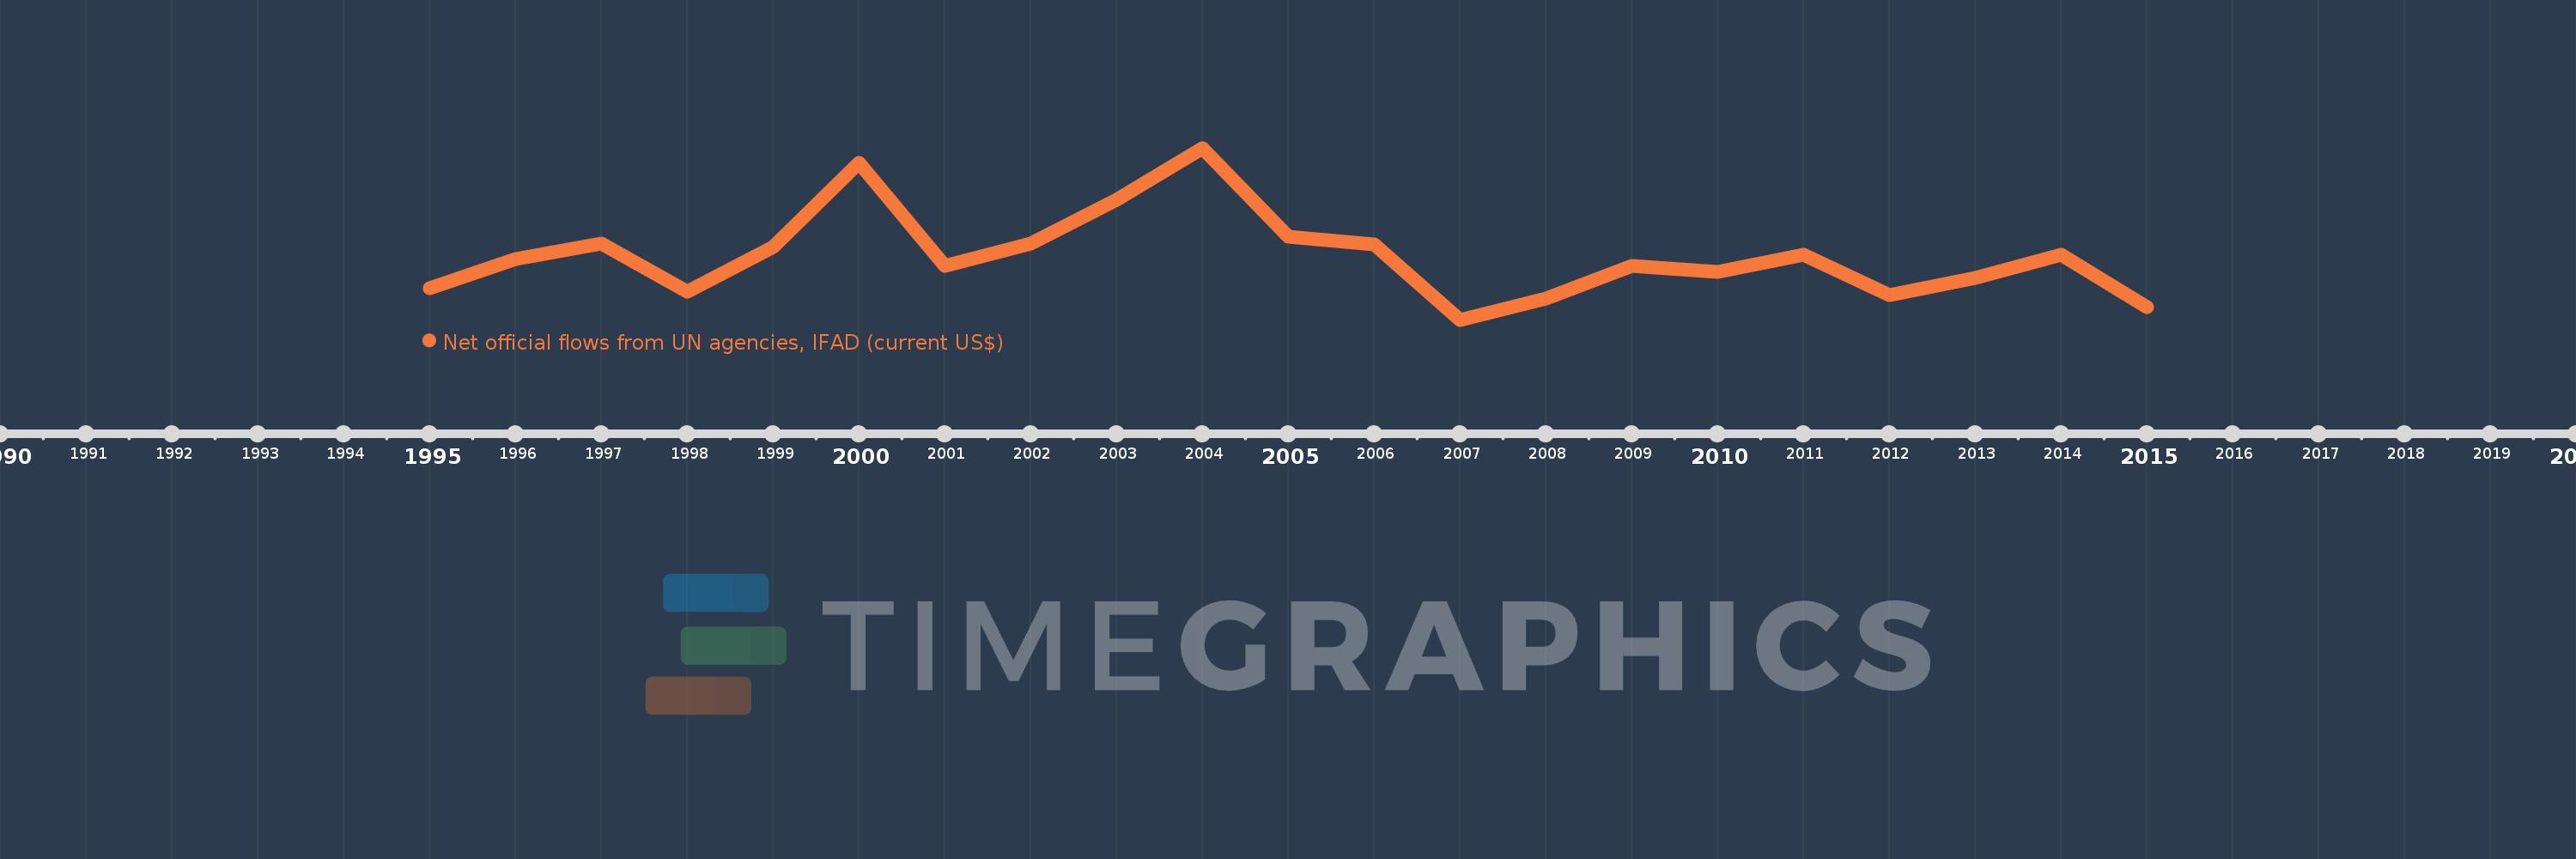
Questa scala temporale mostra un grafico dal 1995 anno al 2015 anno. Albania. I dati fino ad 1994 anno non disponibili. Il numero di osservazioni attuali secondo i date: 21.

La fonte (nome):

Indicatori dello sviluppo mondiale

La fonte (organizzazione):

Development Assistance Committee of the Organisation for Economic Co-operation and Development, Geographical Distribution of Financial Flows to Developing Countries, Development Co-operation Report, and International Development Statistics database. Data are available online at: www.oecd.org/dac/stats/idsonline.

Categorie:

Aid Effectiveness

sono stati aggiornati

23 apr 2017 anni

Indicatori delle variazioni dei valori per anni

In media:
1.931 Mln
Minima:
-370.0 Mille.
1 gen 2007 anni
Massimo:
5.84 Mln
1 gen 2004 anni
Alla data di osservazione
Valore
Variazione assoluta
La variazione rispetto al valore precedente
1 gen 1995 anni
780.0 Mille.
+780.0 Mille.
0.0%
1 gen 1996 anni
1.82 Mln
+1.04 Mln
133.33%
1 gen 1997 anni
2.39 Mln
+570.0 Mille.
31.32%
1 gen 1998 anni
630.0 Mille.
-1.76 Mln
-73.64%
1 gen 1999 anni
2.25 Mln
+1.62 Mln
257.14%
1 gen 2000 anni
5.31 Mln
+3.06 Mln
136.0%
1 gen 2001 anni
1.57 Mln
-3.74 Mln
-70.43%
1 gen 2002 anni
2.37 Mln
+800.0 Mille.
50.96%
1 gen 2003 anni
3.96 Mln
+1.59 Mln
67.09%
1 gen 2004 anni
5.84 Mln
+1.88 Mln
47.47%
1 gen 2005 anni
2.63 Mln
-3.21 Mln
-54.97%
1 gen 2006 anni
2.36 Mln
-270.0 Mille.
-10.27%
1 gen 2007 anni
-370.0 Mille.
-2.73 Mln
-115.68%
1 gen 2008 anni
390.0 Mille.
+760.0 Mille.
-205.41%
1 gen 2009 anni
1.57 Mln
+1.18 Mln
302.56%
1 gen 2010 anni
1.36 Mln
-210.0 Mille.
-13.38%
1 gen 2011 anni
1.97 Mln
+610.0 Mille.
44.85%
1 gen 2012 anni
510.0 Mille.
-1.46 Mln
-74.11%
1 gen 2013 anni
1.15 Mln
+640.0 Mille.
125.49%
1 gen 2014 anni
1.98 Mln
+830.0 Mille.
72.17%
1 gen 2015 anni
80.0 Mille.
-1.9 Mln
-95.96%

Classificazione dei paesi secondo i statistiche attuali per anni