30
/it/
AIzaSyAYiBZKx7MnpbEhh9jyipgxe19OcubqV5w
April 1, 2024
179230
Liberia
LBR
true
2
1
Net official flows from UN agencies, IFAD (current US$)
2015,2014,2013,2012,2011,1993,1991,1989,1988,1987,1986,1985,1984,1983
Download
Biblioteca di statistiche globali →Liberia →

Net official flows from UN agencies, IFAD (current US$)

Queste statistiche in altri paesi:

AfghanistanAlbaniaAlgeriaAngolaArab WorldArgentinaArmeniaAzerbaijanBangladeshBelizeBeninBhutanBoliviaBosnia and HerzegovinaBotswanaBrazilBurkina FasoBurundiCabo VerdeCambodiaCameroonCaribbean small statesCentral African RepublicCentral Europe and the BalticsChadChileChinaColombiaComorosCongo, Dem. Rep.Congo, Rep.Costa RicaCote d'IvoireCubaCyprusDjiboutiDominicaDominican RepublicEast Asia & PacificEast Asia & Pacific (excluding high income)East Asia & Pacific (IDA & IBRD countries)EcuadorEgypt, Arab Rep.El SalvadorEquatorial GuineaEritreaEthiopiaEuro areaEurope & Central AsiaEurope & Central Asia (excluding high income)Europe & Central Asia (IDA & IBRD countries)European UnionFragile and conflict affected situationsGabonGambia, TheGeorgiaGhanaGrenadaGuatemalaGuineaGuinea-BissauGuyanaHaitiHeavily indebted poor countries (HIPC)High incomeHondurasIBRD onlyIDA & IBRD totalIDA blendIDA onlyIDA totalIndiaIndonesiaIraqJamaicaJordanKenyaKorea, Dem. People’s Rep.Kyrgyz RepublicLao PDRLatin America & Caribbean Latin America & Caribbean (excluding high income)Latin America & the Caribbean (IDA & IBRD countries)Least developed countries: UN classificationLebanonLesothoLiberiaLow incomeLower middle incomeMacao SAR, ChinaMacedonia, FYRMadagascarMalawiMaldivesMaliMauritaniaMauritiusMexicoMiddle East & North AfricaMiddle East & North Africa (excluding high income)Middle East & North Africa (IDA & IBRD countries)MoldovaMongoliaMoroccoMozambiqueMyanmarNamibiaNepalNicaraguaNigerNigeriaOECD membersOther small statesPacific island small statesPakistanPanamaPapua New GuineaParaguayPeruPhilippinesRomaniaRwandaSamoaSao Tome and PrincipeSenegalSeychellesSierra LeoneSmall statesSolomon IslandsSomaliaSouth AsiaSouth Asia (IDA & IBRD)South SudanSri LankaSt. LuciaSt. Vincent and the GrenadinesSub-Saharan Africa Sub-Saharan Africa (excluding high income)Sub-Saharan Africa (IDA & IBRD countries)SudanSurinameSwazilandSyrian Arab RepublicTajikistanTanzaniaThailandTimor-LesteTogoTongaTunisiaTurkeyUgandaUpper middle incomeUruguayUzbekistanVenezuela, RBVietnamWest Bank and GazaWorldYemen, Rep.ZambiaZimbabwe

Linea del tempo:

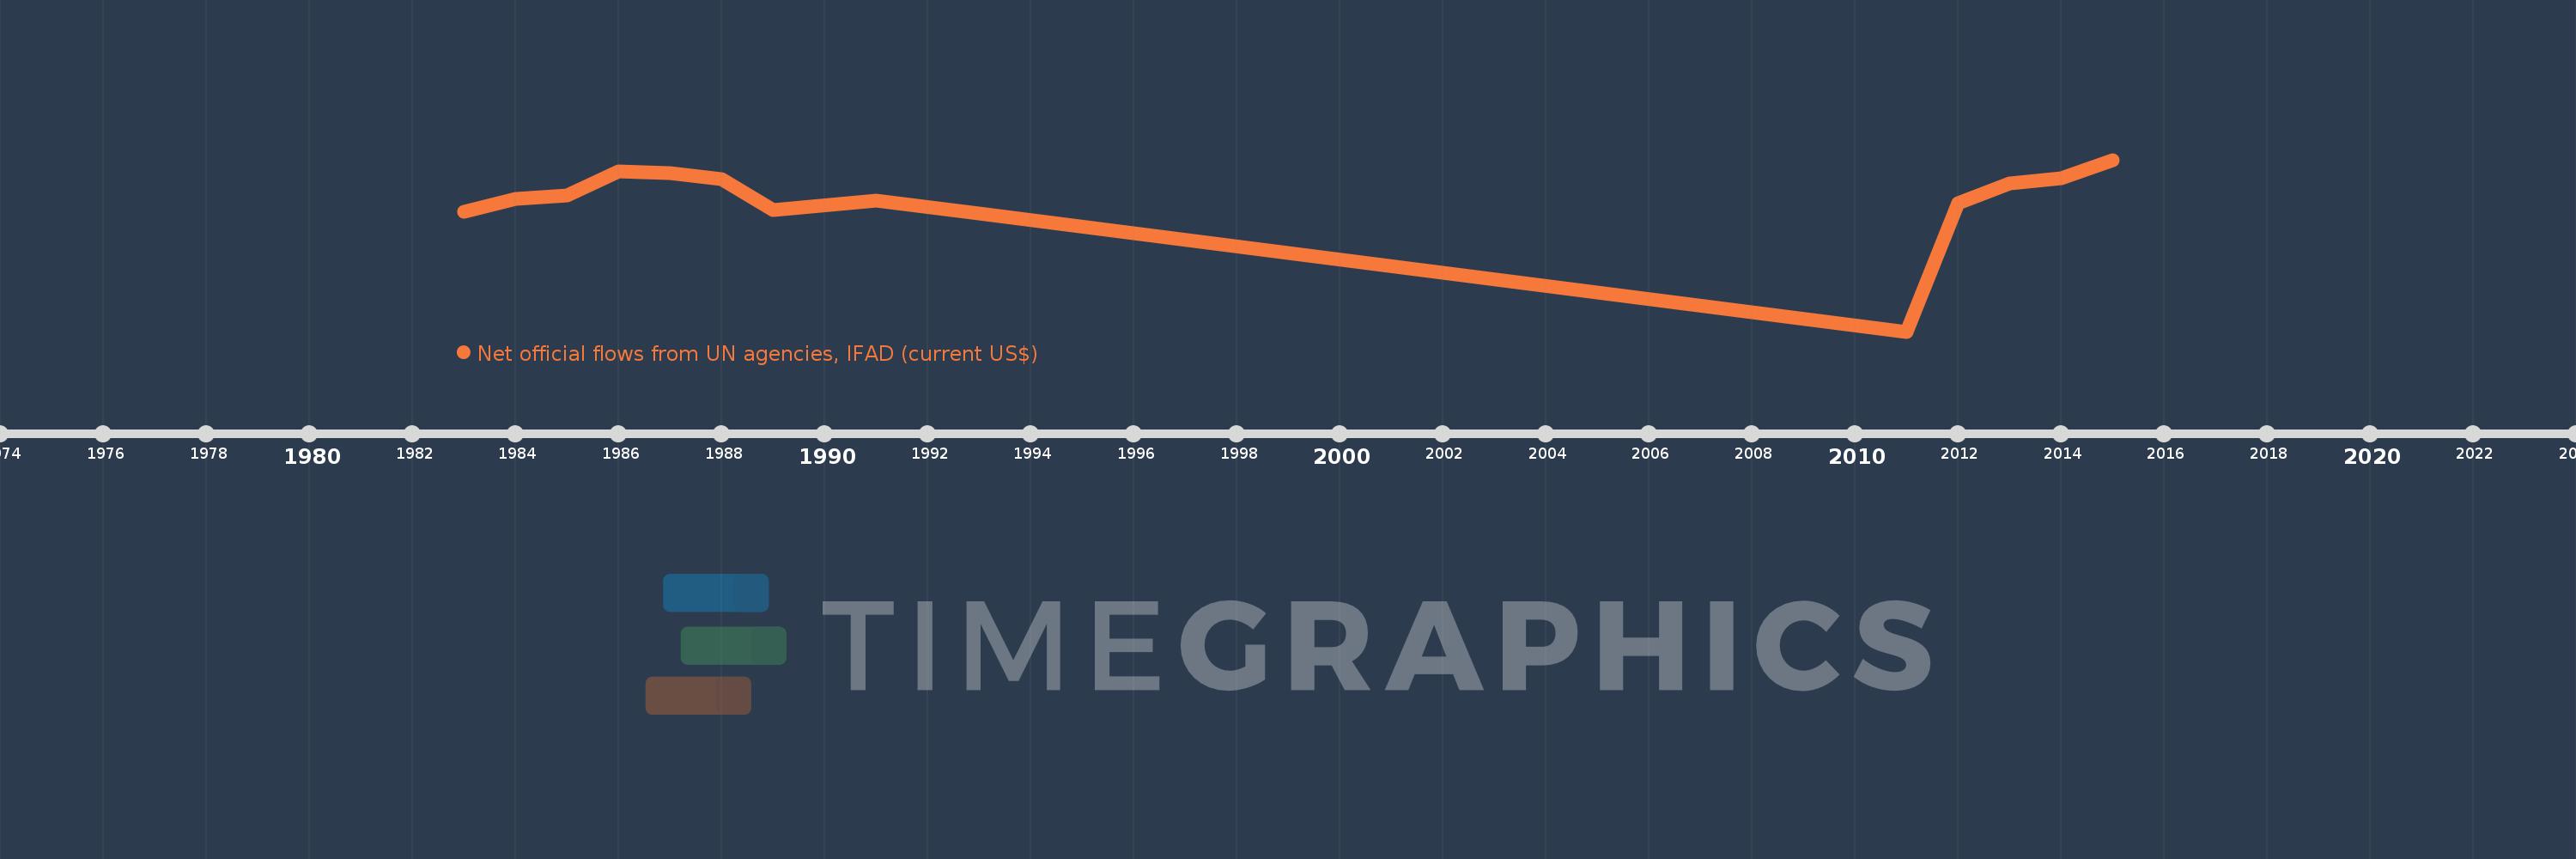
Questa scala temporale mostra un grafico dal 1983 anno al 2015 anno. Liberia. I dati fino ad 1982 anno non disponibili. Il numero di osservazioni attuali secondo i date: 14.

La fonte (nome):

Indicatori dello sviluppo mondiale

La fonte (organizzazione):

Development Assistance Committee of the Organisation for Economic Co-operation and Development, Geographical Distribution of Financial Flows to Developing Countries, Development Co-operation Report, and International Development Statistics database. Data are available online at: www.oecd.org/dac/stats/idsonline.

Categorie:

Aid Effectiveness

sono stati aggiornati

23 apr 2017 anni

Indicatori delle variazioni dei valori per anni

In media:
1.112 Mln
Minima:
-10.25 Mln
1 gen 2011 anni
Massimo:
4.68 Mln
1 gen 2015 anni
Alla data di osservazione
Valore
Variazione assoluta
La variazione rispetto al valore precedente
1 gen 1983 anni
160.0 Mille.
+160.0 Mille.
0.0%
1 gen 1984 anni
1.26 Mln
+1.1 Mln
687.5%
1 gen 1985 anni
1.57 Mln
+310.0 Mille.
24.6%
1 gen 1986 anni
3.67 Mln
+2.1 Mln
133.76%
1 gen 1987 anni
3.5 Mln
-170.0 Mille.
-4.63%
1 gen 1988 anni
3.0 Mln
-500.0 Mille.
-14.29%
1 gen 1989 anni
310.0 Mille.
-2.69 Mln
-89.67%
1 gen 1991 anni
1.1 Mln
+790.0 Mille.
254.84%
1 gen 1993 anni
0.0
-1.1 Mln
-100.0%
1 gen 2011 anni
-10.25 Mln
-10.25 Mln
%
1 gen 2012 anni
910.0 Mille.
+11.16 Mln
-108.88%
1 gen 2013 anni
2.6 Mln
+1.69 Mln
185.71%
1 gen 2014 anni
3.06 Mln
+460.0 Mille.
17.69%
1 gen 2015 anni
4.68 Mln
+1.62 Mln
52.94%

Classificazione dei paesi secondo i statistiche attuali per anni