33
/it/
AIzaSyAYiBZKx7MnpbEhh9jyipgxe19OcubqV5w
August 1, 2025
283925
West Bank and Gaza
PSE
true
2
1
Net official flows from UN agencies, IFAD (current US$)
2015,2014,2013,2012,2011,2010,2008,2006,2005,2003,2001
Download
Biblioteca di statistiche globali →West Bank and Gaza →

Net official flows from UN agencies, IFAD (current US$)

Queste statistiche in altri paesi:

AfghanistanAlbaniaAlgeriaAngolaArab WorldArgentinaArmeniaAzerbaijanBangladeshBelizeBeninBhutanBoliviaBosnia and HerzegovinaBotswanaBrazilBurkina FasoBurundiCabo VerdeCambodiaCameroonCaribbean small statesCentral African RepublicCentral Europe and the BalticsChadChileChinaColombiaComorosCongo, Dem. Rep.Congo, Rep.Costa RicaCote d'IvoireCubaCyprusDjiboutiDominicaDominican RepublicEast Asia & PacificEast Asia & Pacific (excluding high income)East Asia & Pacific (IDA & IBRD countries)EcuadorEgypt, Arab Rep.El SalvadorEquatorial GuineaEritreaEthiopiaEuro areaEurope & Central AsiaEurope & Central Asia (excluding high income)Europe & Central Asia (IDA & IBRD countries)European UnionFragile and conflict affected situationsGabonGambia, TheGeorgiaGhanaGrenadaGuatemalaGuineaGuinea-BissauGuyanaHaitiHeavily indebted poor countries (HIPC)High incomeHondurasIBRD onlyIDA & IBRD totalIDA blendIDA onlyIDA totalIndiaIndonesiaIraqJamaicaJordanKenyaKorea, Dem. People’s Rep.Kyrgyz RepublicLao PDRLatin America & Caribbean Latin America & Caribbean (excluding high income)Latin America & the Caribbean (IDA & IBRD countries)Least developed countries: UN classificationLebanonLesothoLiberiaLow incomeLower middle incomeMacao SAR, ChinaMacedonia, FYRMadagascarMalawiMaldivesMaliMauritaniaMauritiusMexicoMiddle East & North AfricaMiddle East & North Africa (excluding high income)Middle East & North Africa (IDA & IBRD countries)MoldovaMongoliaMoroccoMozambiqueMyanmarNamibiaNepalNicaraguaNigerNigeriaOECD membersOther small statesPacific island small statesPakistanPanamaPapua New GuineaParaguayPeruPhilippinesRomaniaRwandaSamoaSao Tome and PrincipeSenegalSeychellesSierra LeoneSmall statesSolomon IslandsSomaliaSouth AsiaSouth Asia (IDA & IBRD)South SudanSri LankaSt. LuciaSt. Vincent and the GrenadinesSub-Saharan Africa Sub-Saharan Africa (excluding high income)Sub-Saharan Africa (IDA & IBRD countries)SudanSurinameSwazilandSyrian Arab RepublicTajikistanTanzaniaThailandTimor-LesteTogoTongaTunisiaTurkeyUgandaUpper middle incomeUruguayUzbekistanVenezuela, RBVietnamWest Bank and GazaWorldYemen, Rep.ZambiaZimbabwe

Linea del tempo:

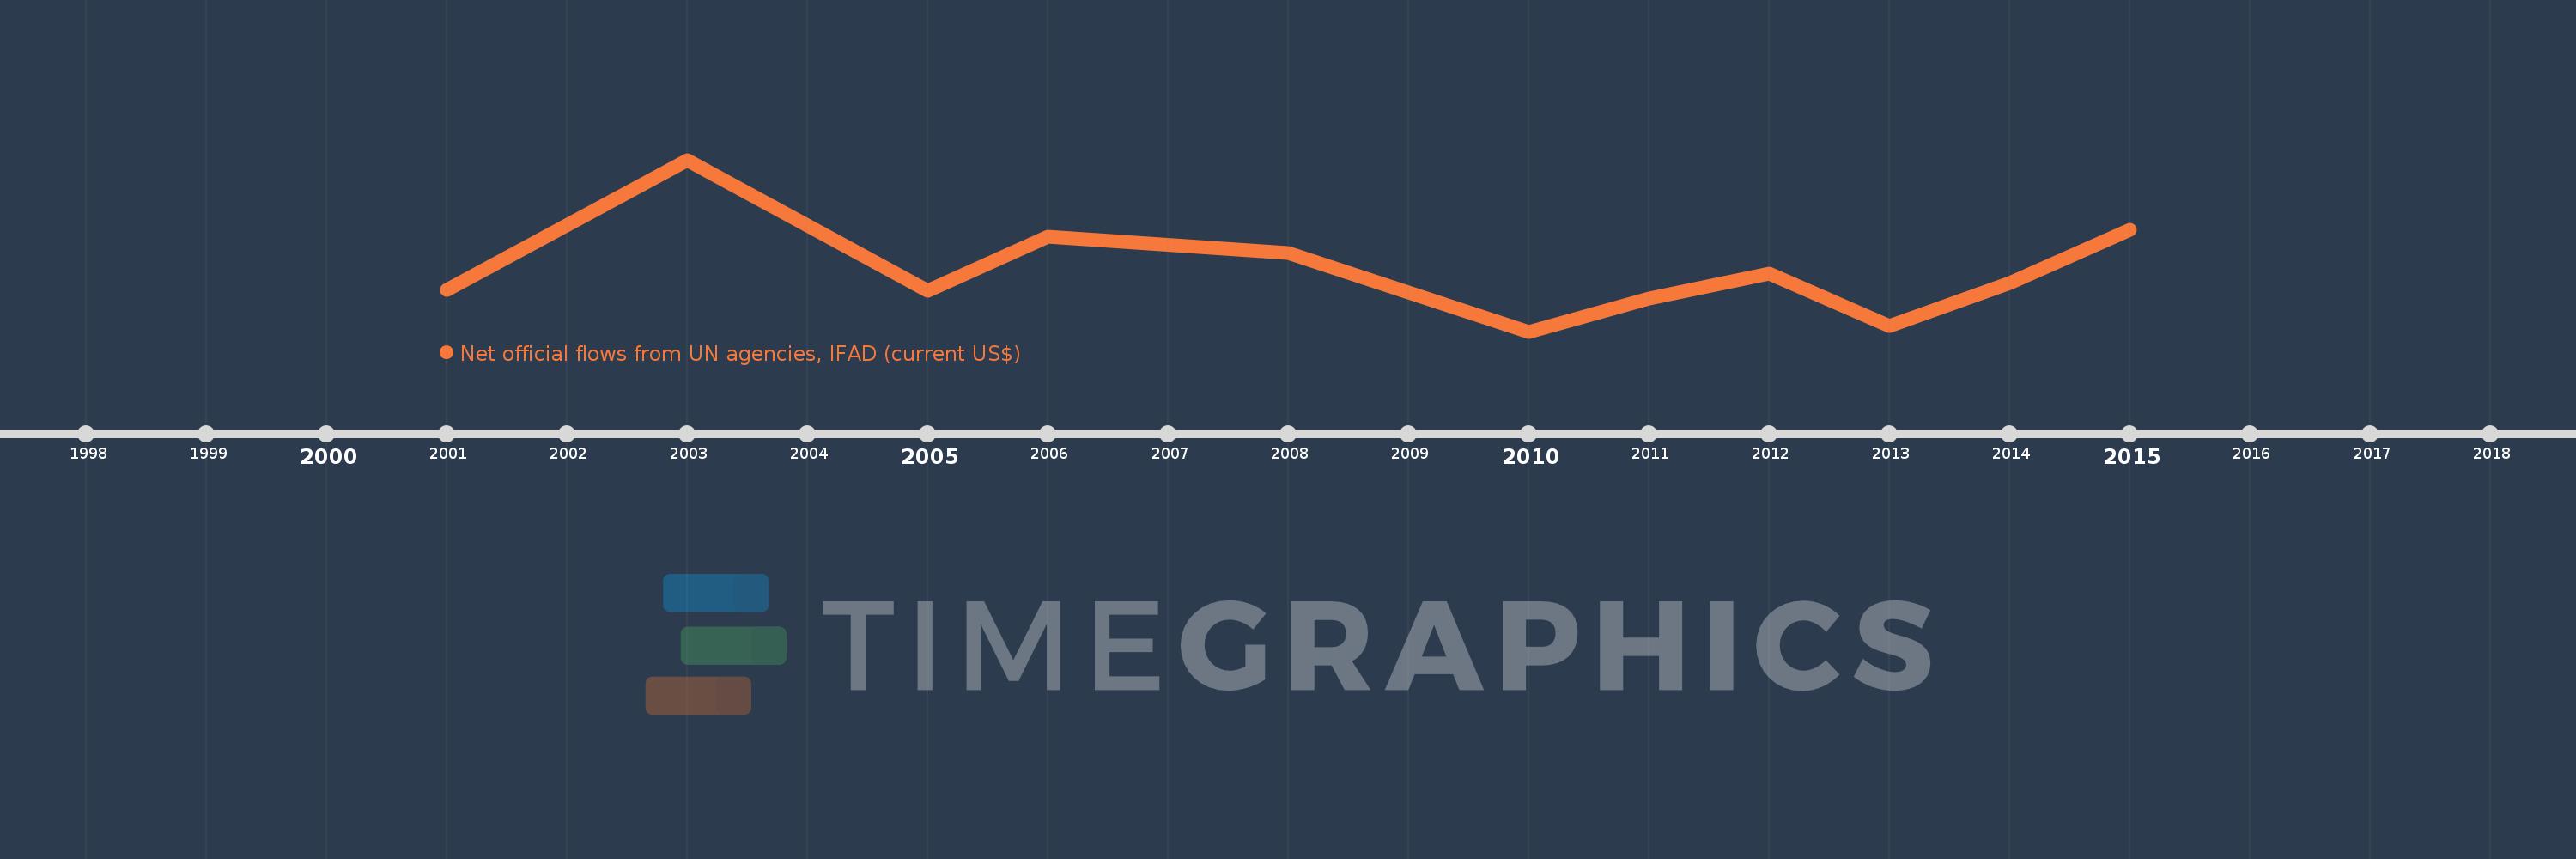
Questa scala temporale mostra un grafico dal 2001 anno al 2015 anno. West Bank and Gaza. I dati fino ad 2000 anno non disponibili. Il numero di osservazioni attuali secondo i date: 11.

La fonte (nome):

Indicatori dello sviluppo mondiale

La fonte (organizzazione):

Development Assistance Committee of the Organisation for Economic Co-operation and Development, Geographical Distribution of Financial Flows to Developing Countries, Development Co-operation Report, and International Development Statistics database. Data are available online at: www.oecd.org/dac/stats/idsonline.

Categorie:

Aid Effectiveness

sono stati aggiornati

23 apr 2017 anni

Indicatori delle variazioni dei valori per anni

In media:
867.273 Mille.
Minima:
-290.0 Mille.
1 gen 2010 anni
Massimo:
2.95 Mln
1 gen 2003 anni
Alla data di osservazione
Valore
Variazione assoluta
La variazione rispetto al valore precedente
1 gen 2001 anni
500.0 Mille.
+500.0 Mille.
0.0%
1 gen 2003 anni
2.95 Mln
+2.45 Mln
490.0%
1 gen 2005 anni
480.0 Mille.
-2.47 Mln
-83.73%
1 gen 2006 anni
1.5 Mln
+1.02 Mln
212.5%
1 gen 2008 anni
1.19 Mln
-310.0 Mille.
-20.67%
1 gen 2010 anni
-290.0 Mille.
-1.48 Mln
-124.37%
1 gen 2011 anni
330.0 Mille.
+620.0 Mille.
-213.79%
1 gen 2012 anni
810.0 Mille.
+480.0 Mille.
145.45%
1 gen 2013 anni
-190.0 Mille.
-1000.0 Mille.
-123.46%
1 gen 2014 anni
630.0 Mille.
+820.0 Mille.
-431.58%
1 gen 2015 anni
1.63 Mln
+1000.0 Mille.
158.73%

Classificazione dei paesi secondo i statistiche attuali per anni