29
/it/
it
AIzaSyAYiBZKx7MnpbEhh9jyipgxe19OcubqV5w
April 1, 2024
138431
Georgia
GEO
true
2
1
Net official flows from UN agencies, IFAD (current US$)
2015,2014,2013,2012,2011,2010,2009,2008,2007,2006,2005,2004,2003,2002,2001,2000,1999
Download
Biblioteca di statistiche globali →Georgia →

Net official flows from UN agencies, IFAD (current US$)

Queste statistiche in altri paesi:
AfghanistanAlbaniaAlgeriaAngolaArab WorldArgentinaArmeniaAzerbaijanBangladeshBelizeBeninBhutanBoliviaBosnia and HerzegovinaBotswanaBrazilBurkina FasoBurundiCabo VerdeCambodiaCameroonCaribbean small statesCentral African RepublicCentral Europe and the BalticsChadChileChinaColombiaComorosCongo, Dem. Rep.Congo, Rep.Costa RicaCote d'IvoireCubaCyprusDjiboutiDominicaDominican RepublicEast Asia & PacificEast Asia & Pacific (excluding high income)East Asia & Pacific (IDA & IBRD countries)EcuadorEgypt, Arab Rep.El SalvadorEquatorial GuineaEritreaEthiopiaEuro areaEurope & Central AsiaEurope & Central Asia (excluding high income)Europe & Central Asia (IDA & IBRD countries)European UnionFragile and conflict affected situationsGabonGambia, TheGeorgiaGhanaGrenadaGuatemalaGuineaGuinea-BissauGuyanaHaitiHeavily indebted poor countries (HIPC)High incomeHondurasIBRD onlyIDA & IBRD totalIDA blendIDA onlyIDA totalIndiaIndonesiaIraqJamaicaJordanKenyaKorea, Dem. People’s Rep.Kyrgyz RepublicLao PDRLatin America & Caribbean Latin America & Caribbean (excluding high income)Latin America & the Caribbean (IDA & IBRD countries)Least developed countries: UN classificationLebanonLesothoLiberiaLow incomeLower middle incomeMacao SAR, ChinaMacedonia, FYRMadagascarMalawiMaldivesMaliMauritaniaMauritiusMexicoMiddle East & North AfricaMiddle East & North Africa (excluding high income)Middle East & North Africa (IDA & IBRD countries)MoldovaMongoliaMoroccoMozambiqueMyanmarNamibiaNepalNicaraguaNigerNigeriaOECD membersOther small statesPacific island small statesPakistanPanamaPapua New GuineaParaguayPeruPhilippinesRomaniaRwandaSamoaSao Tome and PrincipeSenegalSeychellesSierra LeoneSmall statesSolomon IslandsSomaliaSouth AsiaSouth Asia (IDA & IBRD)South SudanSri LankaSt. LuciaSt. Vincent and the GrenadinesSub-Saharan Africa Sub-Saharan Africa (excluding high income)Sub-Saharan Africa (IDA & IBRD countries)SudanSurinameSwazilandSyrian Arab RepublicTajikistanTanzaniaThailandTimor-LesteTogoTongaTunisiaTurkeyUgandaUpper middle incomeUruguayUzbekistanVenezuela, RBVietnamWest Bank and GazaWorldYemen, Rep.ZambiaZimbabwe
Linea del tempo:
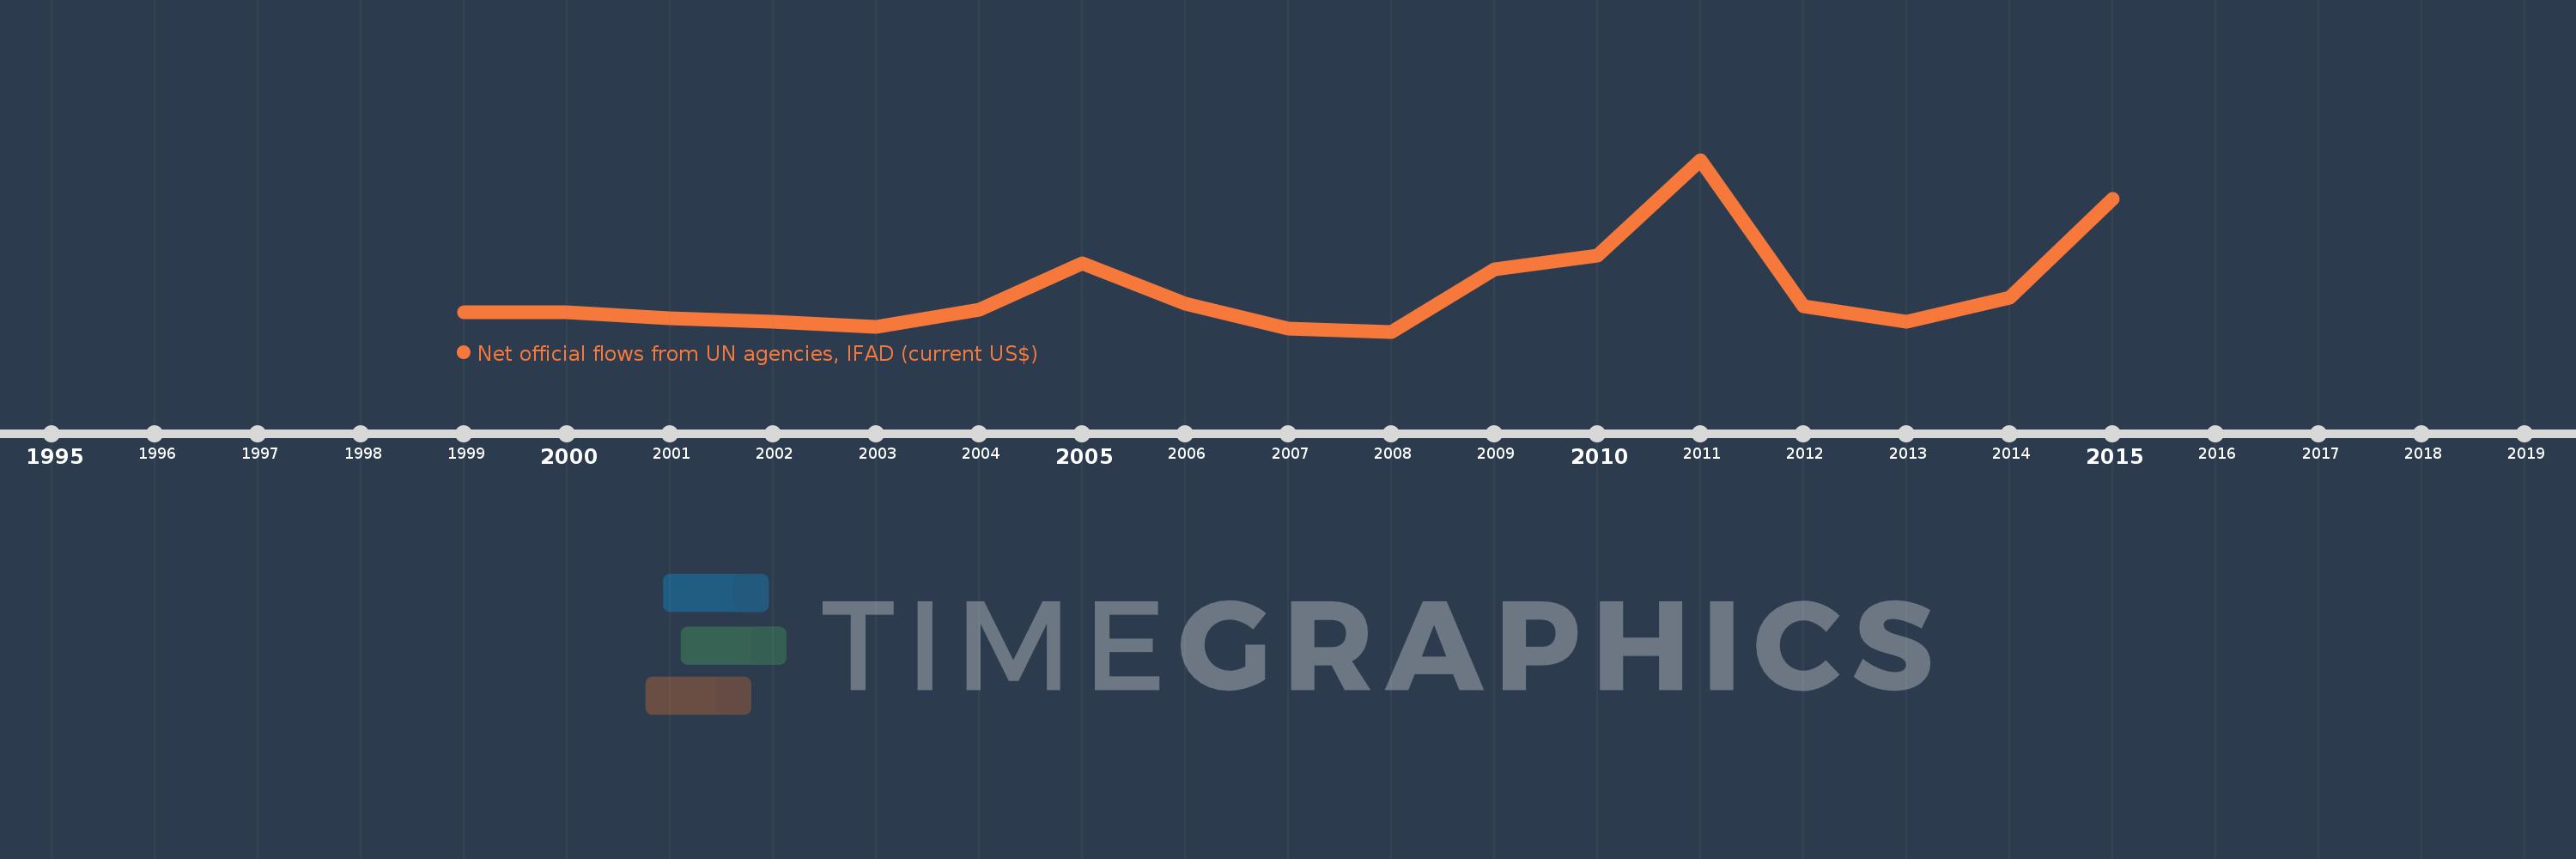
Questa scala temporale mostra un grafico dal 1999 anno al 2015 anno. Georgia. I dati fino ad 1998 anno non disponibili. Il numero di osservazioni attuali secondo i date: 17.
La fonte (nome):
Indicatori dello sviluppo mondiale
La fonte (organizzazione):
Development Assistance Committee of the Organisation for Economic Co-operation and Development, Geographical Distribution of Financial Flows to Developing Countries, Development Co-operation Report, and International Development Statistics database. Data are available online at: www.oecd.org/dac/stats/idsonline.
Categorie:
Aid Effectiveness
sono stati aggiornati
23 apr 2017 anni
Indicatori delle variazioni dei valori per anni
In media:
1.905 Mln
Minima:
420.0 Mille.
1 gen 2008 anni
Massimo:
6.62 Mln
1 gen 2011 anni
Alla data di osservazione
Valore
Variazione assoluta
La variazione rispetto al valore precedente
1 gen 1999 anni
1.11 Mln
+1.11 Mln
0.0%
1 gen 2000 anni
1.13 Mln
+20.0 Mille.
1.8%
1 gen 2001 anni
910.0 Mille.
-220.0 Mille.
-19.47%
1 gen 2002 anni
790.0 Mille.
-120.0 Mille.
-13.19%
1 gen 2003 anni
580.0 Mille.
-210.0 Mille.
-26.58%
1 gen 2004 anni
1.2 Mln
+620.0 Mille.
106.9%
1 gen 2005 anni
2.88 Mln
+1.68 Mln
140.0%
1 gen 2006 anni
1.43 Mln
-1.45 Mln
-50.35%
1 gen 2007 anni
540.0 Mille.
-890.0 Mille.
-62.24%
1 gen 2008 anni
420.0 Mille.
-120.0 Mille.
-22.22%
1 gen 2009 anni
2.66 Mln
+2.24 Mln
533.33%
1 gen 2010 anni
3.15 Mln
+490.0 Mille.
18.42%
1 gen 2011 anni
6.62 Mln
+3.47 Mln
110.16%
1 gen 2012 anni
1.35 Mln
-5.27 Mln
-79.61%
1 gen 2013 anni
770.0 Mille.
-580.0 Mille.
-42.96%
1 gen 2014 anni
1.65 Mln
+880.0 Mille.
114.29%
1 gen 2015 anni
5.2 Mln
+3.55 Mln
215.15%
Classificazione dei paesi secondo i statistiche attuali per anni

Commenti:

Inviare
PremiumAbout & FeedbackAccordoPrivatezza
logo
© 2022 Selected Technologies LLC – Morgan Hill, California