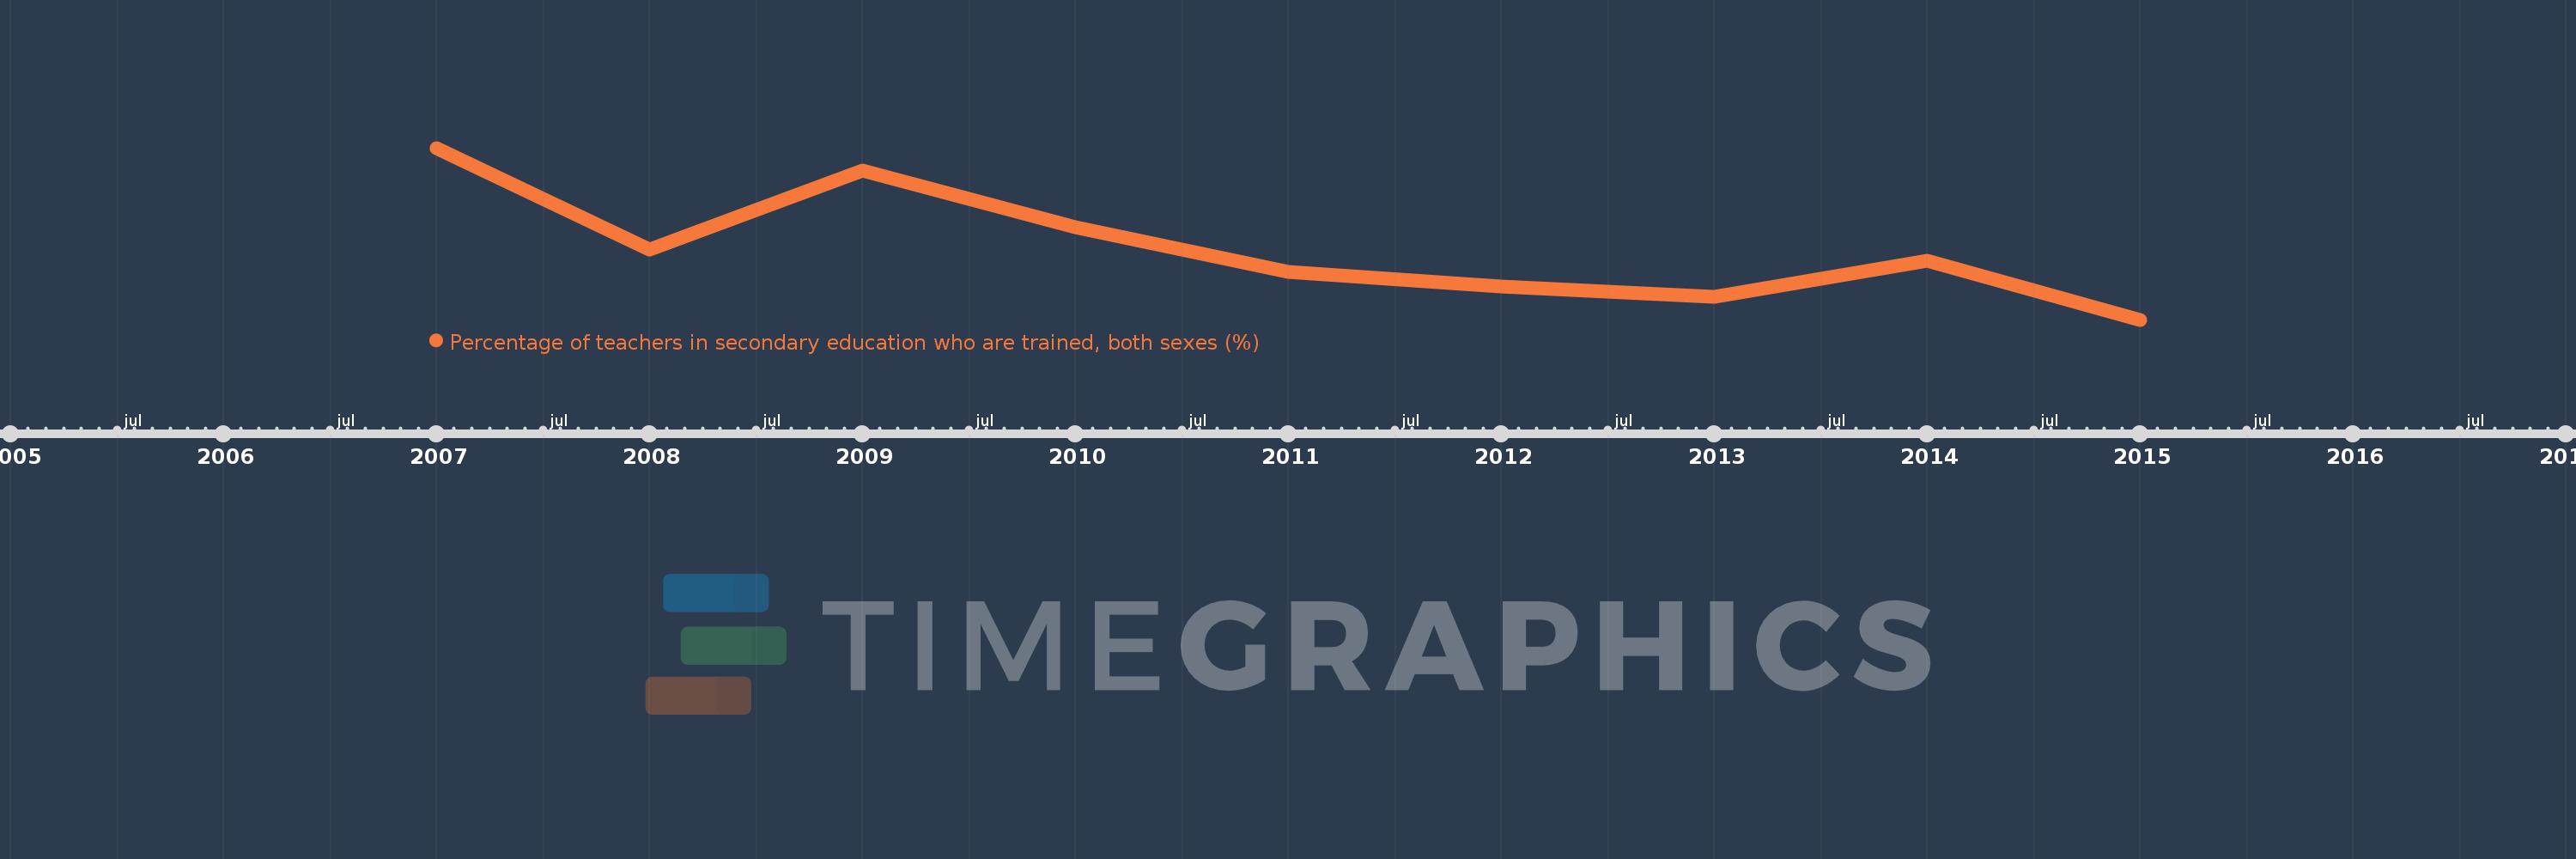
Questa scala temporale mostra un grafico dal 2007 anno al 2015 anno. Sub-Saharan Africa (IDA & IBRD countries). I dati fino ad 2006 anno non disponibili. Il numero di osservazioni attuali secondo i date: 9.
La fonte (nome):
Indicatori dello sviluppo mondiale
La fonte (organizzazione):
UNESCO Institute for Statistics
Categorie:
Education
sono stati aggiornati
23 apr 2017 anni
Indicatori delle variazioni dei valori per anni
In media:
61.923
Minima:
55.246
1 gen 2015 anni
Massimo:
71.222
1 gen 2007 anni
Alla data di osservazione
Valore
Variazione assoluta
La variazione rispetto al valore precedente
1 gen 2007 anni
71.222
+71.222
0.0%
1 gen 2008 anni
61.805
-9.417
-13.22%
1 gen 2009 anni
69.121
+7.316
11.84%
1 gen 2010 anni
63.824
-5.296
-7.66%
1 gen 2011 anni
59.681
-4.143
-6.49%
1 gen 2012 anni
58.333
-1.348
-2.26%
1 gen 2013 anni
57.356
-0.977
-1.68%
1 gen 2014 anni
60.719
+3.364
5.86%
1 gen 2015 anni
55.246
-5.473
-9.01%
Classificazione dei paesi secondo i statistiche attuali per anni