33
/it/
AIzaSyAYiBZKx7MnpbEhh9jyipgxe19OcubqV5w
May 1, 2025
275124
United Arab Emirates
ARE
true
2
1
Percentage of teachers in secondary education who are trained, both sexes (%)
2015,2014,2013,2006,2005,2003,2002,2001,2000
Download
Biblioteca di statistiche globali →United Arab Emirates →

Percentage of teachers in secondary education who are trained, both sexes (%)

Queste statistiche in altri paesi:

AndorraAntigua and BarbudaArab WorldArubaBahamas, TheBahrainBangladeshBarbadosBelarusBelizeBeninBermudaBhutanBotswanaBritish Virgin IslandsBrunei DarussalamBurkina FasoBurundiCabo VerdeCambodiaCameroonCaribbean small statesCayman IslandsChadColombiaComorosCongo, Dem. Rep.Congo, Rep.Costa RicaCote d'IvoireCroatiaCubaDjiboutiDominicaDominican RepublicEcuadorEgypt, Arab Rep.El SalvadorEquatorial GuineaEritreaEthiopiaFijiFragile and conflict affected situationsGambia, TheGeorgiaGhanaGibraltarGrenadaGuineaGuyanaHeavily indebted poor countries (HIPC)HondurasHong Kong SAR, ChinaIDA blendIDA onlyIDA totalIran, Islamic Rep.IraqJamaicaKazakhstanKenyaKiribatiKuwaitKyrgyz RepublicLao PDRLatin America & Caribbean Latin America & Caribbean (excluding high income)Latin America & the Caribbean (IDA & IBRD countries)Least developed countries: UN classificationLebanonLesothoLiberiaLow incomeMacao SAR, ChinaMadagascarMalawiMalaysiaMaldivesMaliMauritaniaMauritiusMexicoMiddle East & North AfricaMiddle East & North Africa (excluding high income)Middle East & North Africa (IDA & IBRD countries)MongoliaMozambiqueMyanmarNamibiaNauruNepalNicaraguaNigerNigeriaOmanOther small statesPacific island small statesPanamaPapua New GuineaParaguayPeruPhilippinesPre-demographic dividendQatarRwandaSao Tome and PrincipeSaudi ArabiaSerbiaSeychellesSierra LeoneSingaporeSmall statesSolomon IslandsSri LankaSt. Kitts and NevisSt. LuciaSt. Vincent and the GrenadinesSub-Saharan Africa Sub-Saharan Africa (excluding high income)Sub-Saharan Africa (IDA & IBRD countries)SudanSurinameSwazilandSyrian Arab RepublicTajikistanTogoTongaTurks and Caicos IslandsUgandaUnited Arab EmiratesUzbekistanWest Bank and GazaZimbabwe

Linea del tempo:

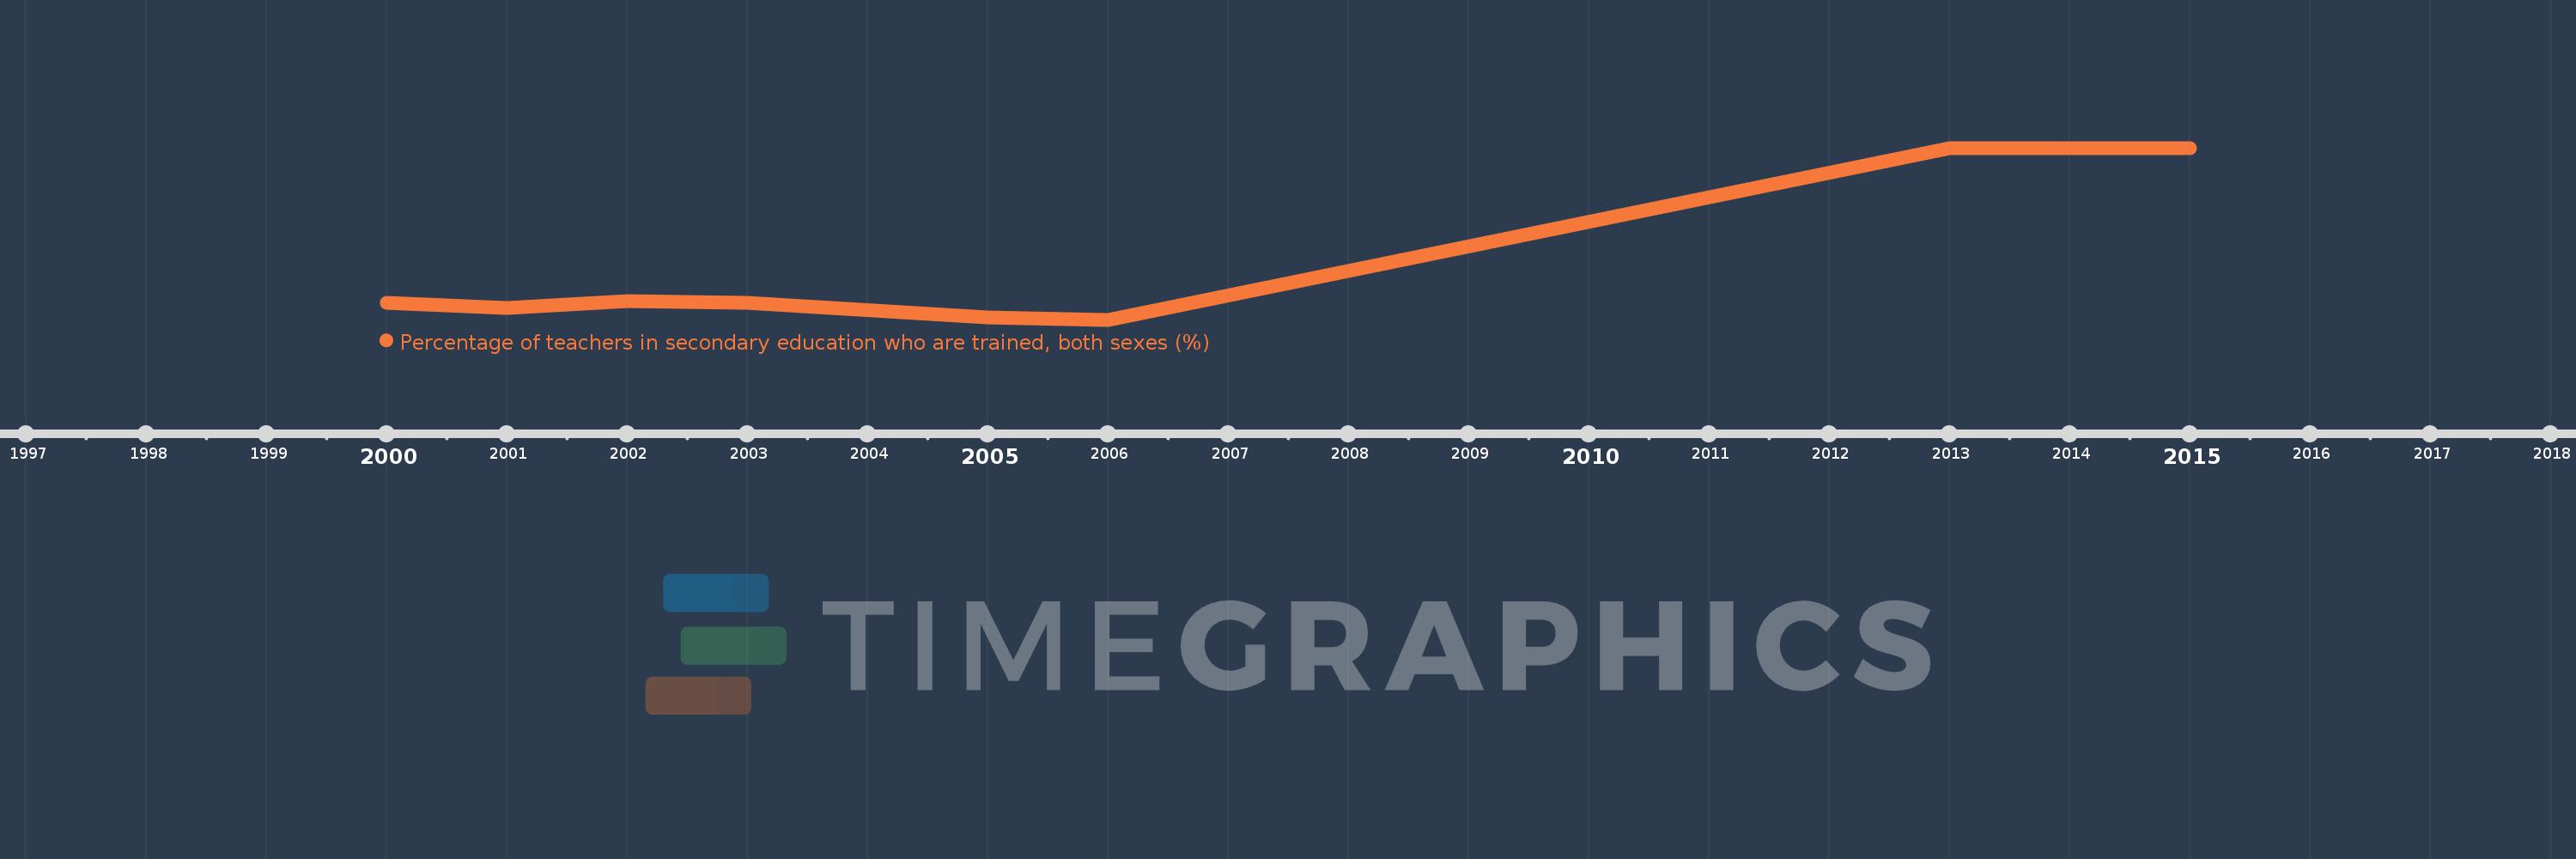
Questa scala temporale mostra un grafico dal 2000 anno al 2015 anno. United Arab Emirates. I dati fino ad 1999 anno non disponibili. Il numero di osservazioni attuali secondo i date: 9.

La fonte (nome):

Indicatori dello sviluppo mondiale

La fonte (organizzazione):

UNESCO Institute for Statistics

Categorie:

Education

sono stati aggiornati

23 apr 2017 anni

Indicatori delle variazioni dei valori per anni

In media:
66.592
Minima:
46.433
1 gen 2006 anni
Massimo:
100.0
1 gen 2013 anni
Alla data di osservazione
Valore
Variazione assoluta
La variazione rispetto al valore precedente
1 gen 2000 anni
51.687
+51.687
0.0%
1 gen 2001 anni
50.192
-1.495
-2.89%
1 gen 2002 anni
52.307
+2.115
4.21%
1 gen 2003 anni
51.649
-0.658
-1.26%
1 gen 2005 anni
47.063
-4.586
-8.88%
1 gen 2006 anni
46.433
-0.63
-1.34%
1 gen 2013 anni
100.0
+53.567
115.37%
1 gen 2014 anni
100.0
0.0
0.0%
1 gen 2015 anni
100.0
0.0
0.0%

Classificazione dei paesi secondo i statistiche attuali per anni