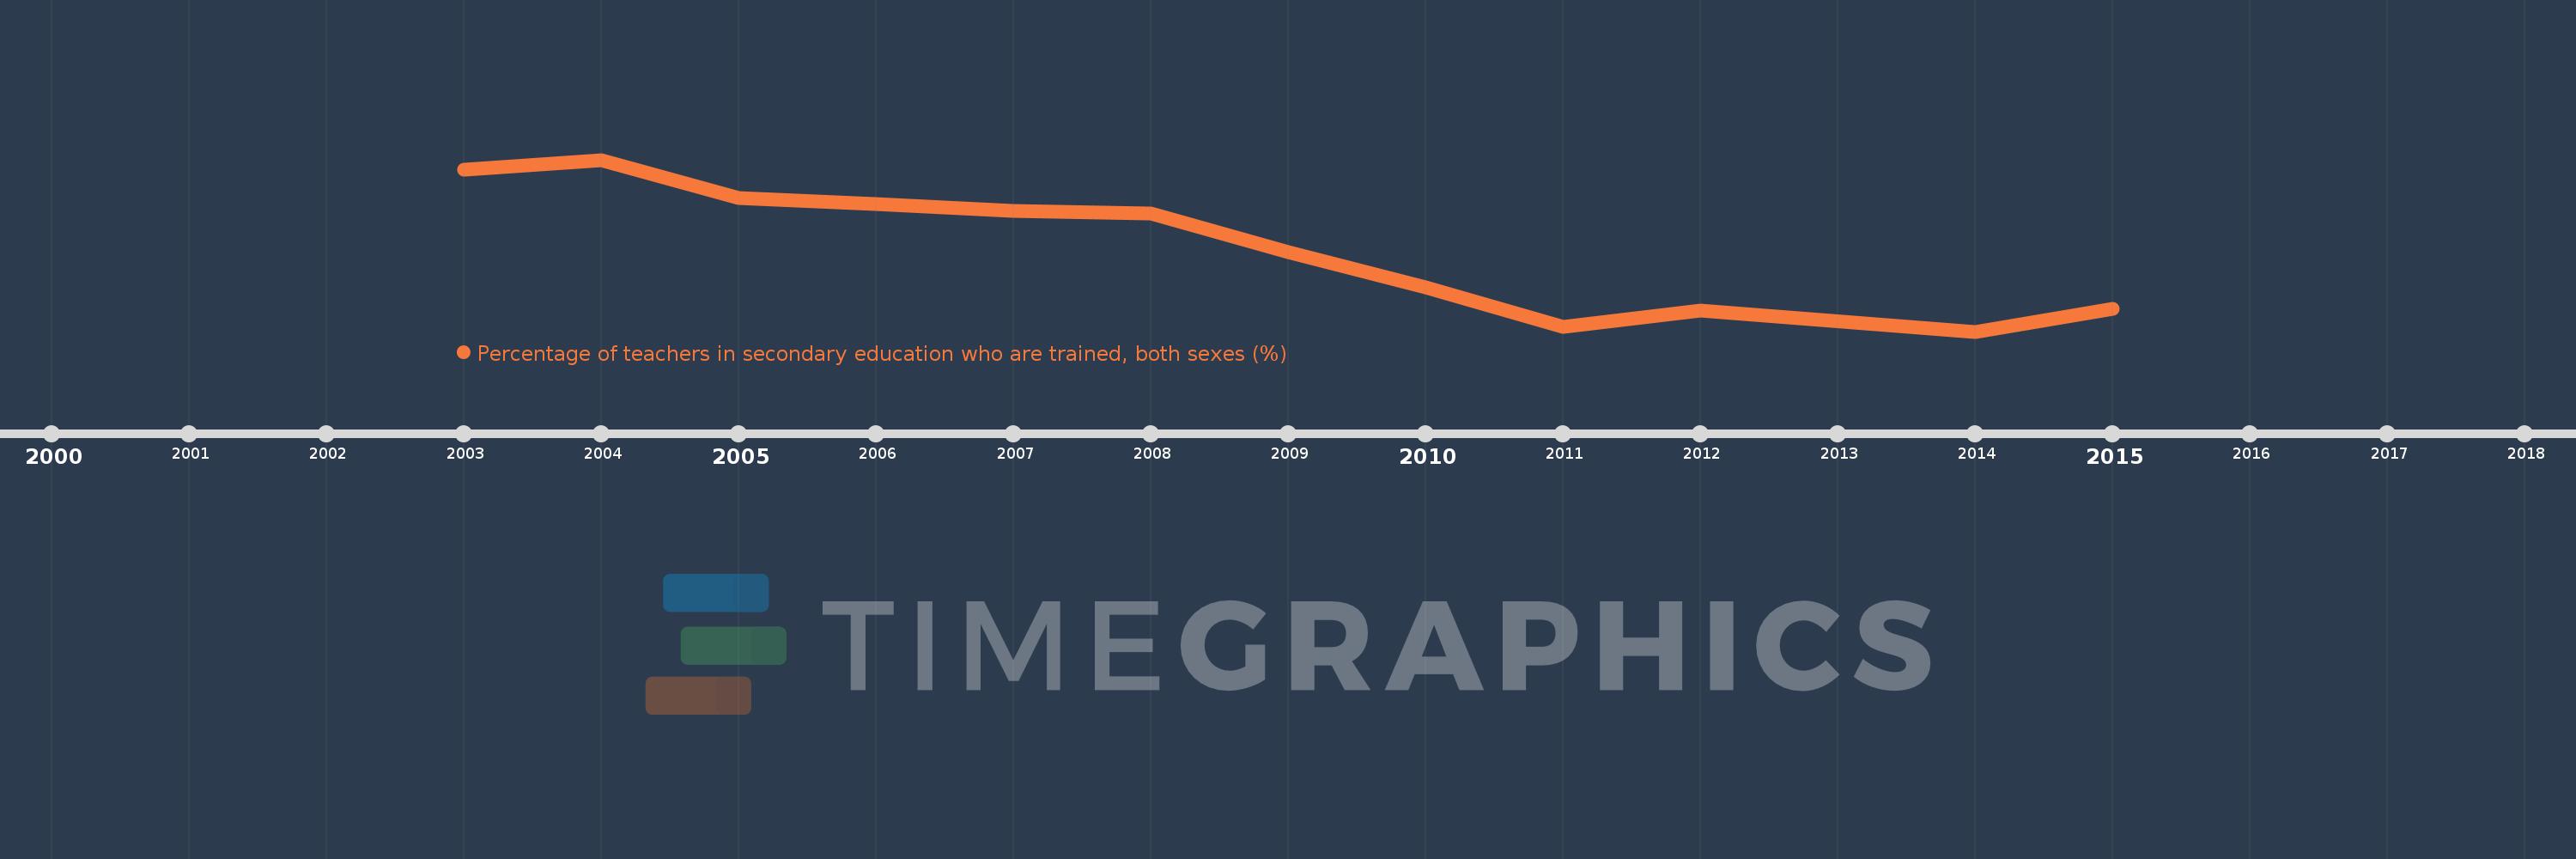
Questa scala temporale mostra un grafico dal 2003 anno al 2015 anno. Caribbean small states. I dati fino ad 2002 anno non disponibili. Il numero di osservazioni attuali secondo i date: 12.
La fonte (nome):
Indicatori dello sviluppo mondiale
La fonte (organizzazione):
UNESCO Institute for Statistics
Categorie:
Education
sono stati aggiornati
23 apr 2017 anni
Indicatori delle variazioni dei valori per anni
In media:
70.165
Minima:
61.374
1 gen 2014 anni
Massimo:
79.379
1 gen 2004 anni
Alla data di osservazione
Valore
Variazione assoluta
La variazione rispetto al valore precedente
1 gen 2003 anni
78.371
+78.371
0.0%
1 gen 2004 anni
79.379
+1.008
1.29%
1 gen 2005 anni
75.346
-4.033
-5.08%
1 gen 2006 anni
74.779
-0.566
-0.75%
1 gen 2007 anni
74.042
-0.738
-0.99%
1 gen 2008 anni
73.771
-0.27
-0.37%
1 gen 2009 anni
69.726
-4.045
-5.48%
1 gen 2010 anni
65.998
-3.728
-5.35%
1 gen 2011 anni
61.864
-4.133
-6.26%
1 gen 2012 anni
63.566
+1.702
2.75%
1 gen 2014 anni
61.374
-2.192
-3.45%
1 gen 2015 anni
63.759
+2.385
3.89%
Classificazione dei paesi secondo i statistiche attuali per anni