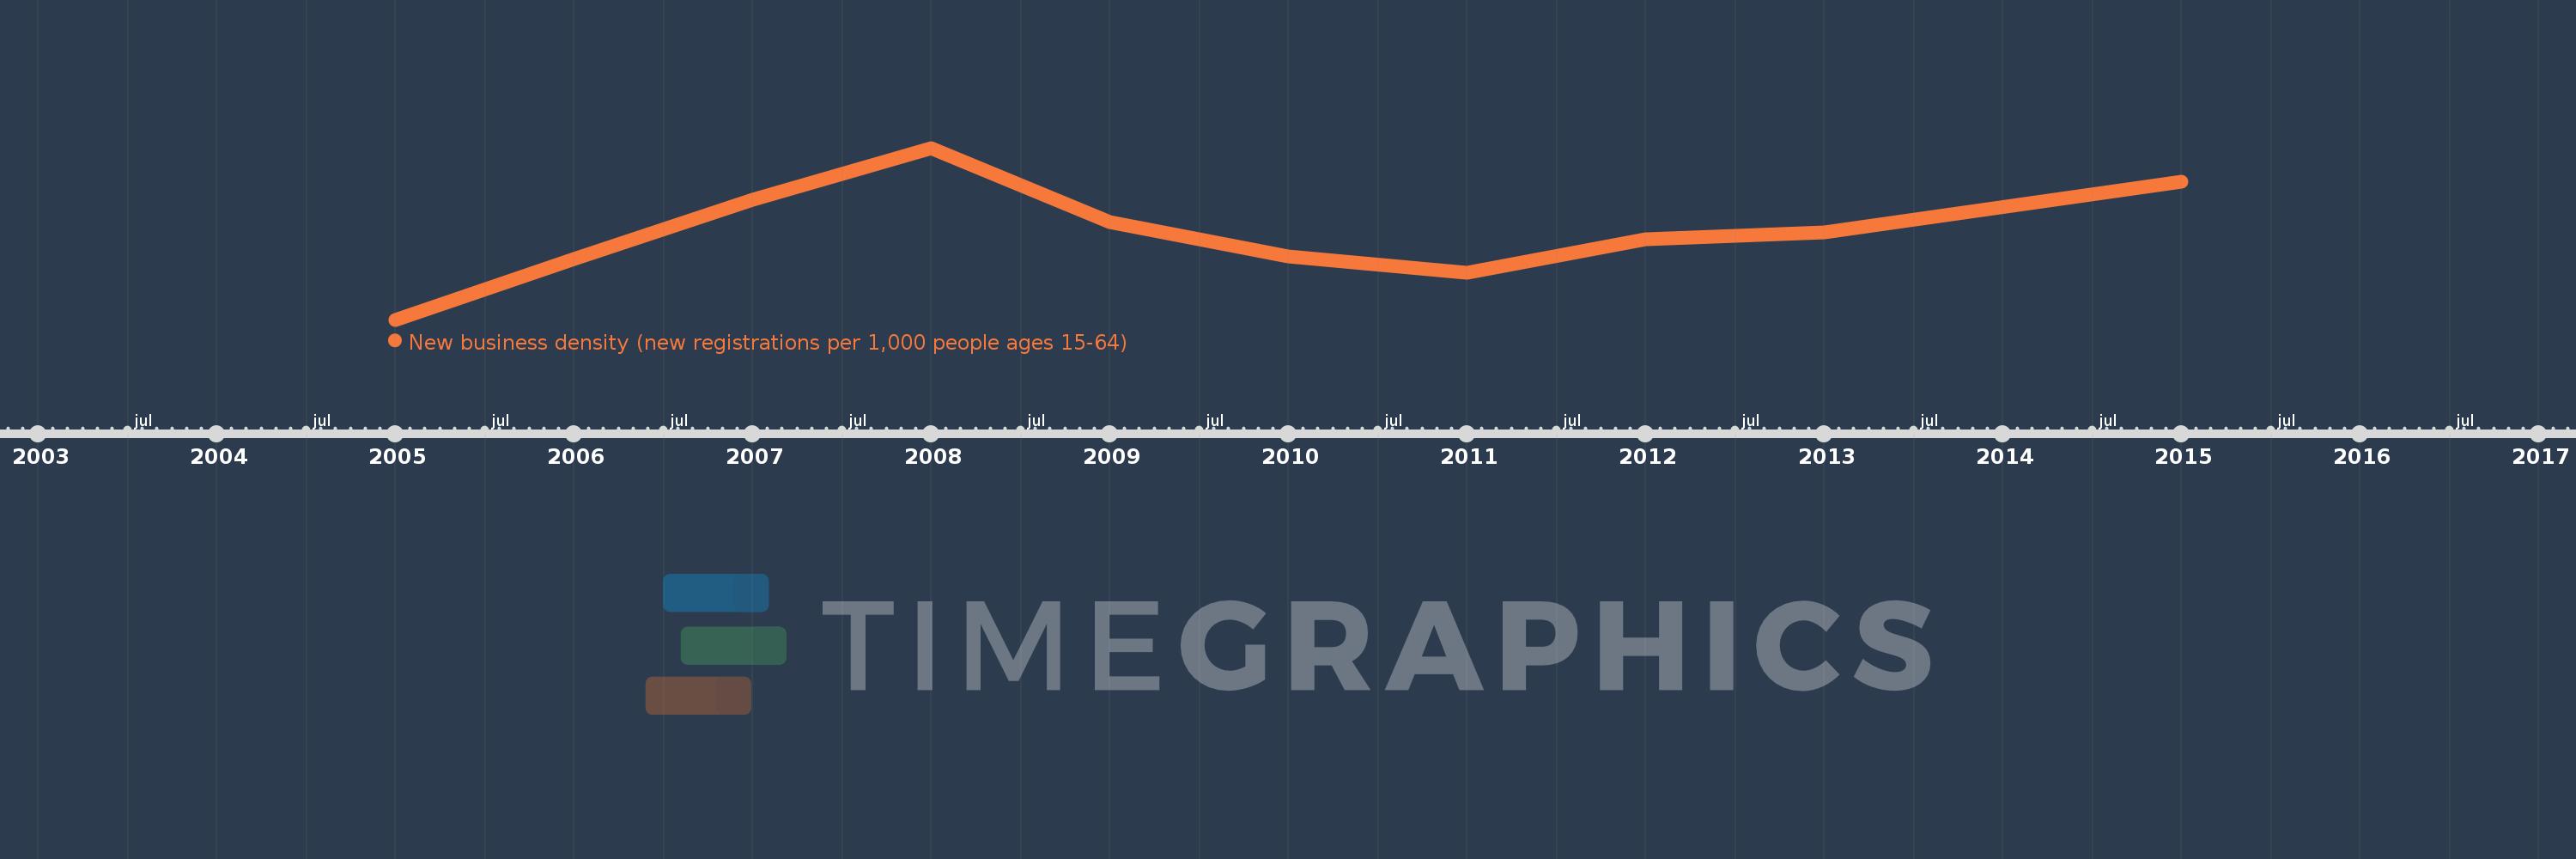
Questa scala temporale mostra un grafico dal 2005 anno al 2015 anno. Small states. I dati fino ad 2004 anno non disponibili. Il numero di osservazioni attuali secondo i date: 10.
La fonte (nome):
Indicatori dello sviluppo mondiale
La fonte (organizzazione):
World Bank's Entrepreneurship Survey and database (http://econ.worldbank.org/research/entrepreneurship).
Categorie:
Private Sector
sono stati aggiornati
23 apr 2017 anni
Indicatori delle variazioni dei valori per anni
In media:
5.05
Minima:
3.807
1 gen 2005 anni
Massimo:
6.275
1 gen 2008 anni
Alla data di osservazione
Valore
Variazione assoluta
La variazione rispetto al valore precedente
1 gen 2005 anni
3.807
+3.807
0.0%
1 gen 2006 anni
4.681
+0.873
22.94%
1 gen 2007 anni
5.527
+0.846
18.07%
1 gen 2008 anni
6.275
+0.748
13.53%
1 gen 2009 anni
5.212
-1.062
-16.93%
1 gen 2010 anni
4.711
-0.501
-9.62%
1 gen 2011 anni
4.477
-0.234
-4.97%
1 gen 2012 anni
4.962
+0.485
10.84%
1 gen 2013 anni
5.068
+0.105
2.12%
1 gen 2015 anni
5.785
+0.717
14.16%
Classificazione dei paesi secondo i statistiche attuali per anni