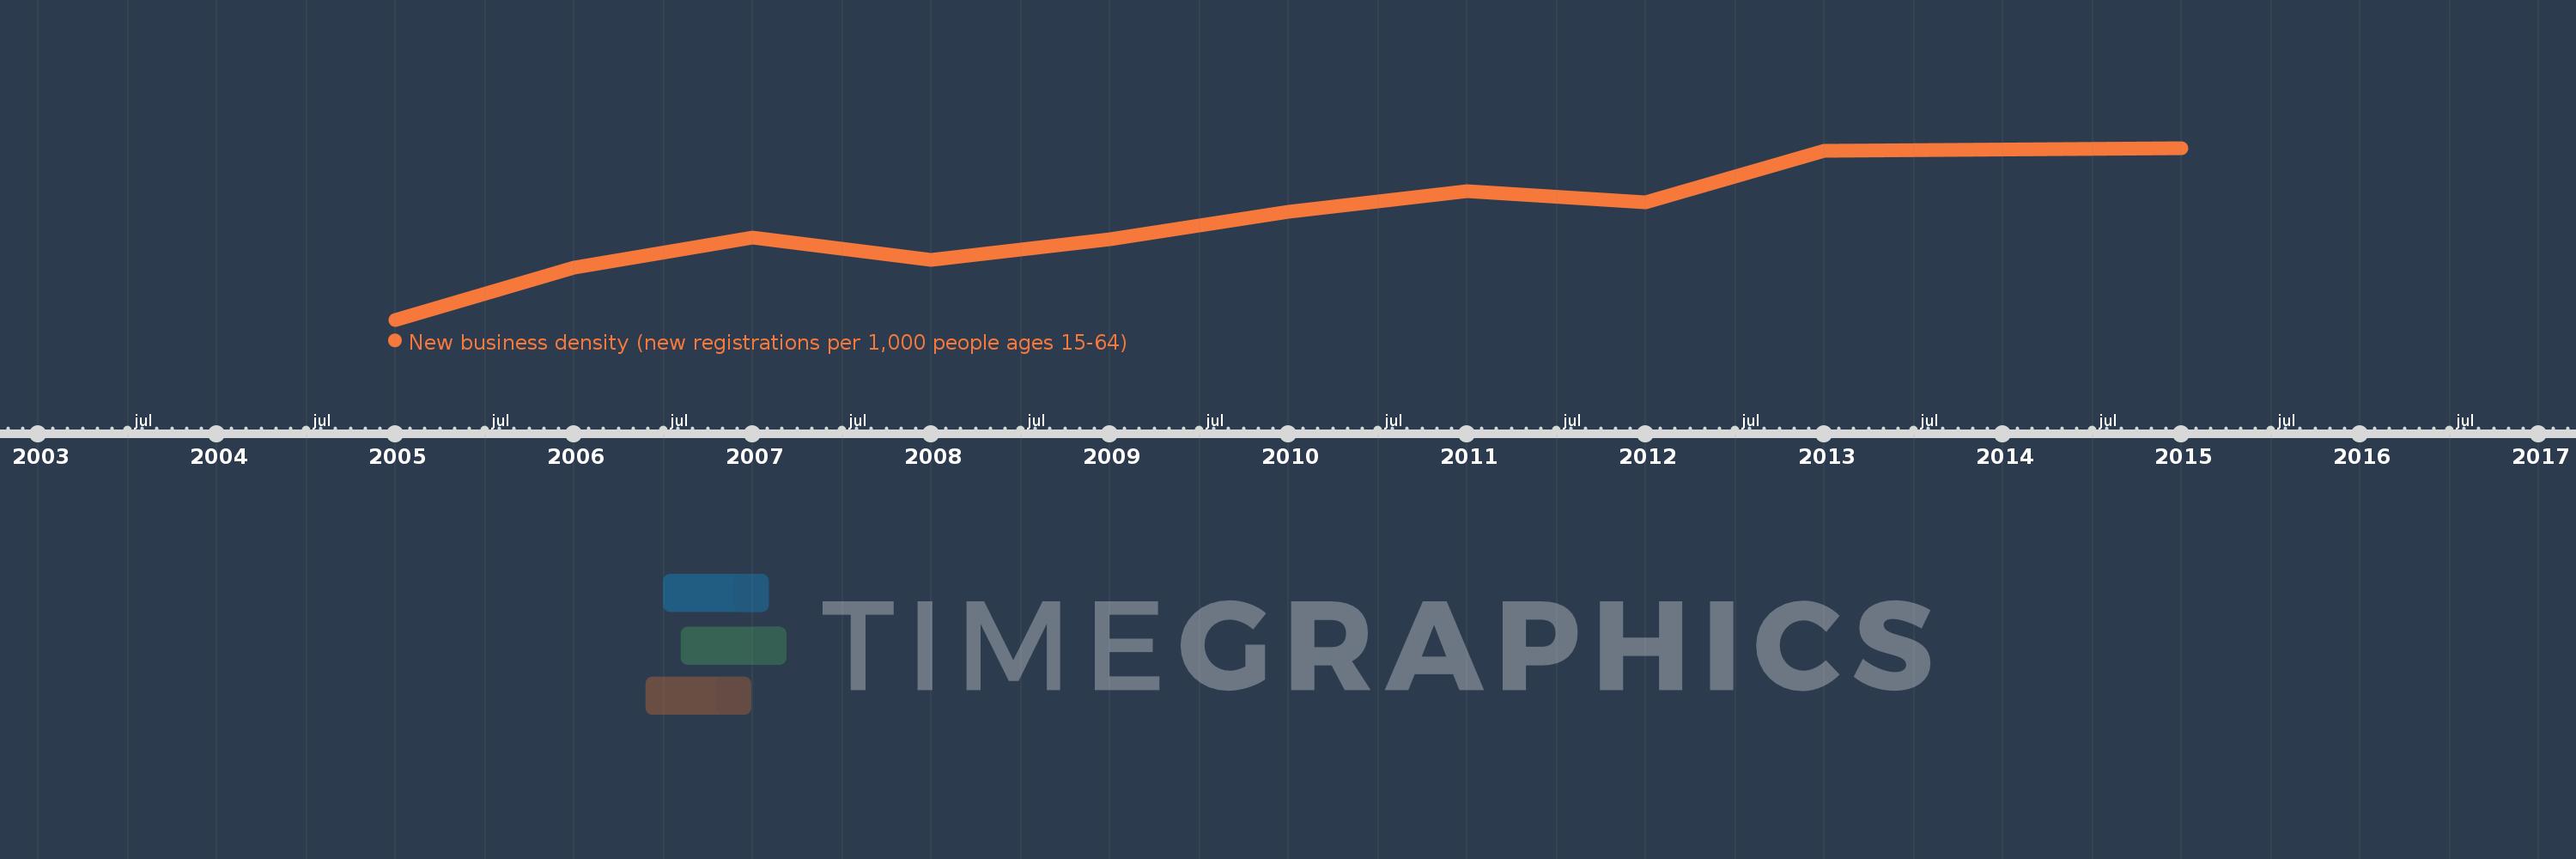
Questa scala temporale mostra un grafico dal 2005 anno al 2015 anno. Jordan. I dati fino ad 2004 anno non disponibili. Il numero di osservazioni attuali secondo i date: 10.
La fonte (nome):
Indicatori dello sviluppo mondiale
La fonte (organizzazione):
World Bank's Entrepreneurship Survey and database (http://econ.worldbank.org/research/entrepreneurship).
Categorie:
Private Sector
sono stati aggiornati
23 apr 2017 anni
Indicatori delle variazioni dei valori per anni
In media:
0.719
Minima:
0.369
1 gen 2005 anni
Massimo:
0.99
1 gen 2015 anni
Alla data di osservazione
Valore
Variazione assoluta
La variazione rispetto al valore precedente
1 gen 2005 anni
0.369
+0.369
0.0%
1 gen 2006 anni
0.557
+0.188
50.8%
1 gen 2007 anni
0.665
+0.109
19.53%
1 gen 2008 anni
0.584
-0.082
-12.25%
1 gen 2009 anni
0.661
+0.077
13.24%
1 gen 2010 anni
0.758
+0.096
14.57%
1 gen 2011 anni
0.835
+0.078
10.24%
1 gen 2012 anni
0.793
-0.042
-4.99%
1 gen 2013 anni
0.981
+0.188
23.68%
1 gen 2015 anni
0.99
+0.009
0.88%
Classificazione dei paesi secondo i statistiche attuali per anni