30
/it/
AIzaSyAYiBZKx7MnpbEhh9jyipgxe19OcubqV5w
April 1, 2024
55030
Post-demographic dividend
PST
false
2
1
New business density (new registrations per 1,000 people ages 15-64)
2015,2014,2013,2012,2011,2010,2009,2008,2007,2006,2005
Download
Biblioteca di statistiche globali →Post-demographic dividend →

New business density (new registrations per 1,000 people ages 15-64)

Queste statistiche in altri paesi:

AfghanistanAlbaniaAlgeriaAntigua and BarbudaArab WorldArgentinaArmeniaAustraliaAustriaAzerbaijanBangladeshBelarusBelgiumBelizeBhutanBoliviaBosnia and HerzegovinaBotswanaBrazilBritish Virgin IslandsBulgariaBurkina FasoCambodiaCanadaCaribbean small statesCentral Europe and the BalticsChileColombiaCongo, Dem. Rep.Costa RicaCroatiaCyprusCzech RepublicDenmarkDominicaDominican RepublicEarly-demographic dividendEast Asia & PacificEast Asia & Pacific (excluding high income)East Asia & Pacific (IDA & IBRD countries)Egypt, Arab Rep.El SalvadorEstoniaEthiopiaEuro areaEurope & Central AsiaEurope & Central Asia (excluding high income)Europe & Central Asia (IDA & IBRD countries)European UnionFinlandFragile and conflict affected situationsFranceGabonGeorgiaGermanyGhanaGreeceGrenadaGuatemalaGuineaHaitiHeavily indebted poor countries (HIPC)High incomeHong Kong SAR, ChinaHungaryIBRD onlyIcelandIDA & IBRD totalIDA blendIDA onlyIDA totalIndiaIndonesiaIraqIrelandIsle of ManIsraelItalyJamaicaJapanJordanKazakhstanKenyaKiribatiKorea, Rep.KosovoKyrgyz RepublicLao PDRLate-demographic dividendLatin America & Caribbean Latin America & Caribbean (excluding high income)Latin America & the Caribbean (IDA & IBRD countries)LatviaLeast developed countries: UN classificationLesothoLiechtensteinLithuaniaLow & middle incomeLow incomeLower middle incomeLuxembourgMacedonia, FYRMadagascarMalawiMalaysiaMaldivesMaltaMauritiusMexicoMiddle East & North AfricaMiddle East & North Africa (excluding high income)Middle East & North Africa (IDA & IBRD countries)Middle incomeMoldovaMongoliaMontenegroMoroccoNamibiaNepalNetherlandsNew ZealandNigerNigeriaNorth AmericaNorwayOECD membersOmanOther small statesPacific island small statesPakistanPanamaPeruPhilippinesPolandPortugalPost-demographic dividendPre-demographic dividendQatarRomaniaRussian FederationRwandaSamoaSao Tome and PrincipeSenegalSerbiaSierra LeoneSingaporeSlovak RepublicSloveniaSmall statesSouth AfricaSouth AsiaSouth Asia (IDA & IBRD)South SudanSpainSri LankaSt. Kitts and NevisSt. LuciaSt. Vincent and the GrenadinesSub-Saharan Africa Sub-Saharan Africa (excluding high income)Sub-Saharan Africa (IDA & IBRD countries)SurinameSwedenSwitzerlandSyrian Arab RepublicTajikistanThailandTimor-LesteTogoTongaTunisiaTurkeyUgandaUkraineUnited Arab EmiratesUnited KingdomUpper middle incomeUruguayUzbekistanVanuatuWorldZambia

Linea del tempo:

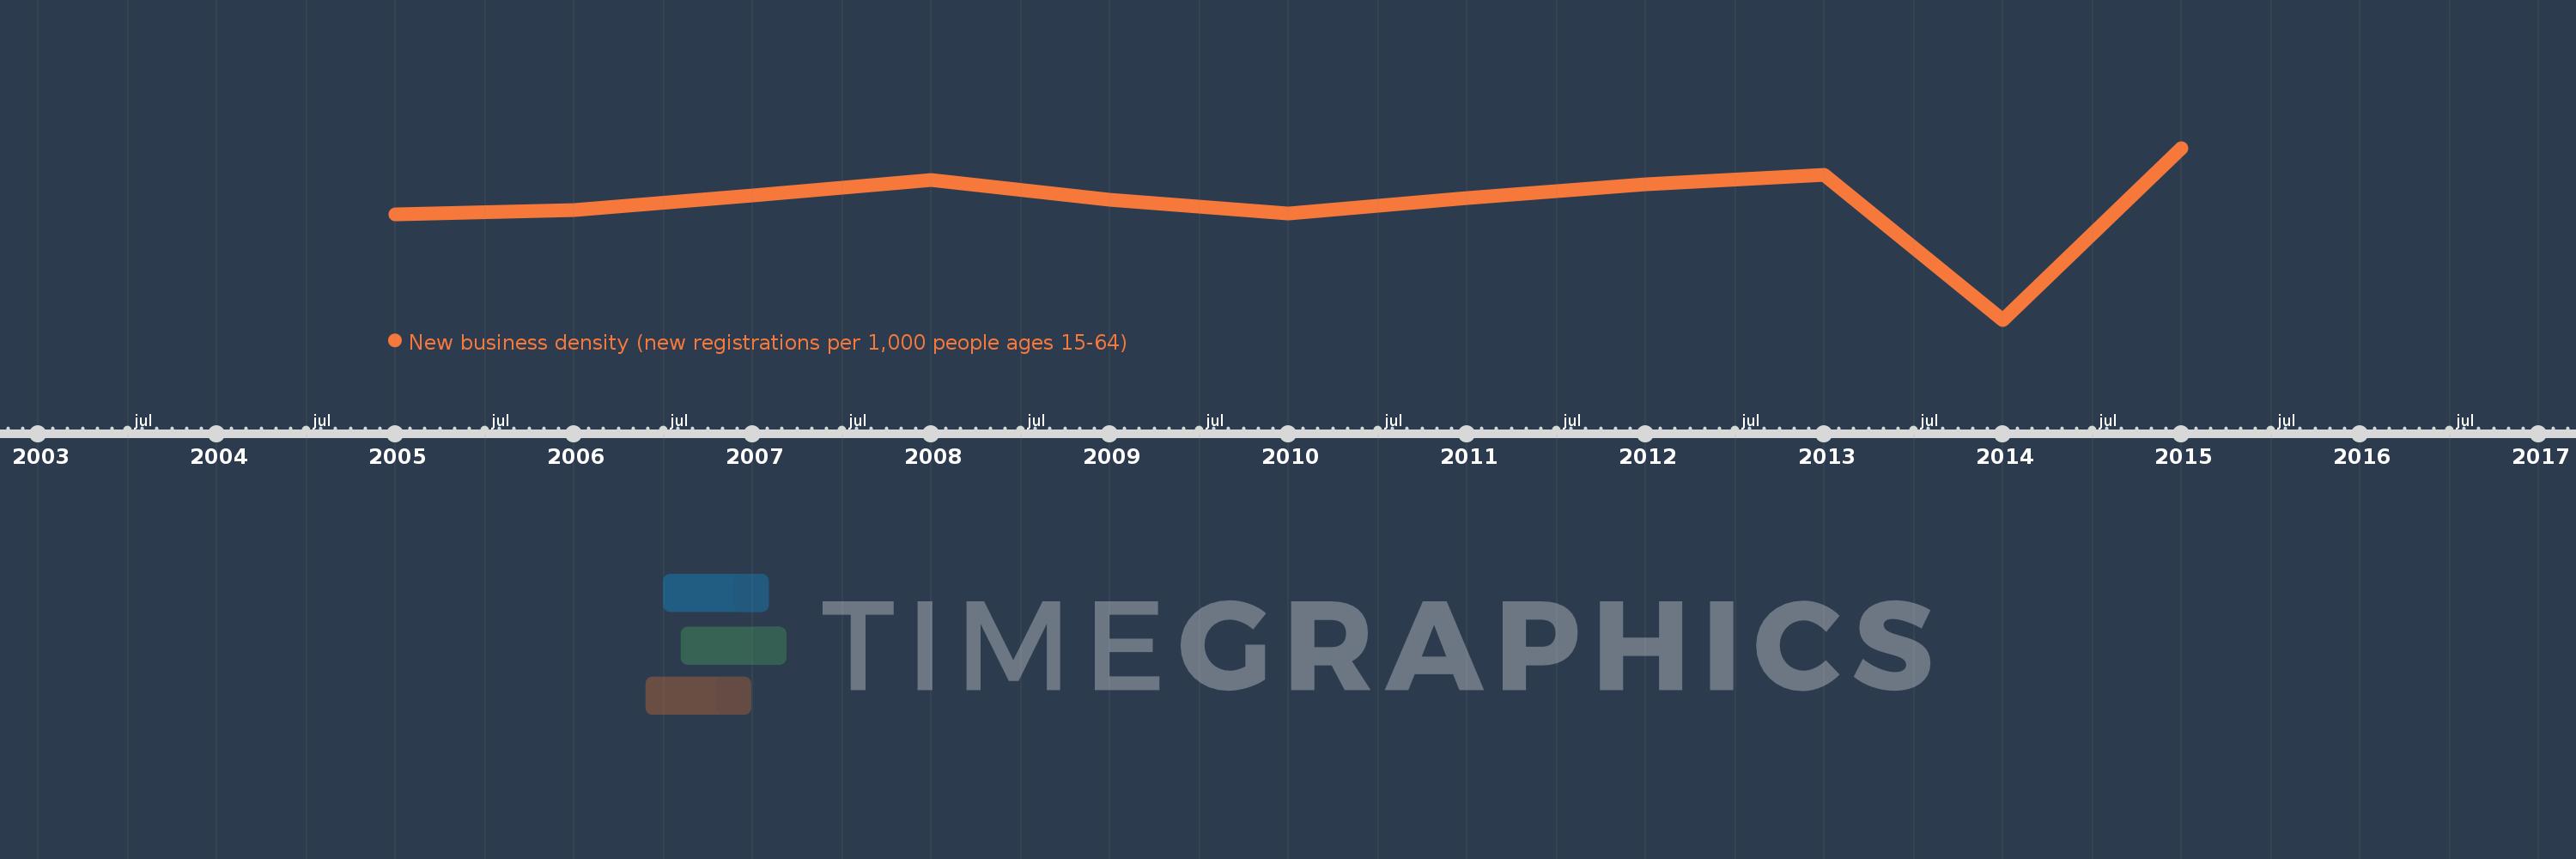
Questa scala temporale mostra un grafico dal 2005 anno al 2015 anno. Post-demographic dividend. I dati fino ad 2004 anno non disponibili. Il numero di osservazioni attuali secondo i date: 11.

La fonte (nome):

Indicatori dello sviluppo mondiale

La fonte (organizzazione):

World Bank's Entrepreneurship Survey and database (http://econ.worldbank.org/research/entrepreneurship).

Categorie:

Private Sector

sono stati aggiornati

23 apr 2017 anni

Indicatori delle variazioni dei valori per anni

In media:
4.763
Minima:
1.67
1 gen 2014 anni
Massimo:
6.243
1 gen 2015 anni
Alla data di osservazione
Valore
Variazione assoluta
La variazione rispetto al valore precedente
1 gen 2005 anni
4.466
+4.466
0.0%
1 gen 2006 anni
4.597
+0.131
2.93%
1 gen 2007 anni
4.968
+0.371
8.06%
1 gen 2008 anni
5.398
+0.43
8.66%
1 gen 2009 anni
4.853
-0.546
-10.11%
1 gen 2010 anni
4.49
-0.363
-7.48%
1 gen 2011 anni
4.899
+0.409
9.11%
1 gen 2012 anni
5.285
+0.386
7.88%
1 gen 2013 anni
5.526
+0.241
4.56%
1 gen 2014 anni
1.67
-3.856
-69.78%
1 gen 2015 anni
6.243
+4.573
273.85%

Classificazione dei paesi secondo i statistiche attuali per anni