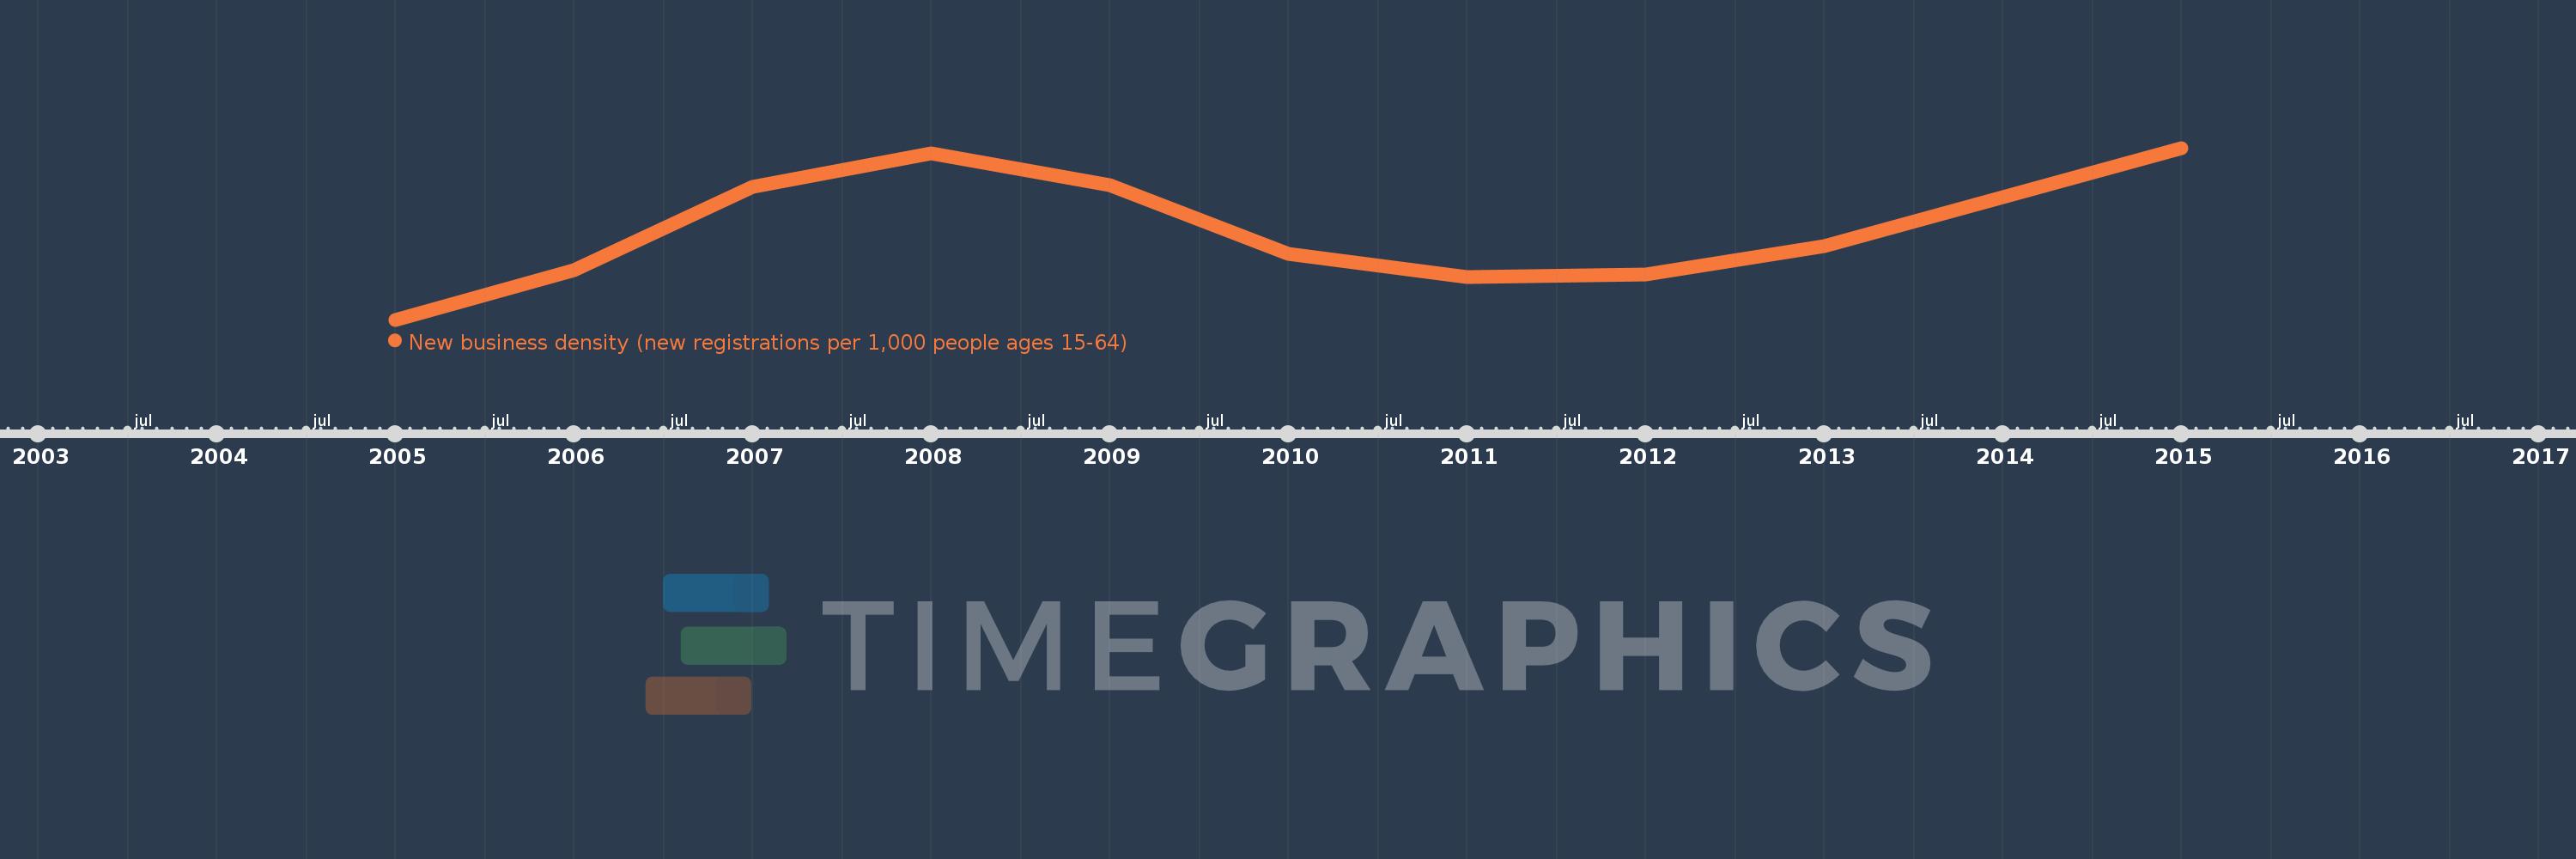
Questa scala temporale mostra un grafico dal 2005 anno al 2015 anno. Netherlands. I dati fino ad 2004 anno non disponibili. Il numero di osservazioni attuali secondo i date: 10.
La fonte (nome):
Indicatori dello sviluppo mondiale
La fonte (organizzazione):
World Bank's Entrepreneurship Survey and database (http://econ.worldbank.org/research/entrepreneurship).
Categorie:
Private Sector
sono stati aggiornati
23 apr 2017 anni
Indicatori delle variazioni dei valori per anni
In media:
4.576
Minima:
3.77
1 gen 2005 anni
Massimo:
5.34
1 gen 2015 anni
Alla data di osservazione
Valore
Variazione assoluta
La variazione rispetto al valore precedente
1 gen 2005 anni
3.77
+3.77
0.0%
1 gen 2006 anni
4.221
+0.451
11.96%
1 gen 2007 anni
4.981
+0.76
18.0%
1 gen 2008 anni
5.288
+0.307
6.17%
1 gen 2009 anni
5.001
-0.287
-5.44%
1 gen 2010 anni
4.376
-0.625
-12.49%
1 gen 2011 anni
4.162
-0.215
-4.91%
1 gen 2012 anni
4.18
+0.019
0.45%
1 gen 2013 anni
4.443
+0.262
6.27%
1 gen 2015 anni
5.34
+0.897
20.2%
Classificazione dei paesi secondo i statistiche attuali per anni