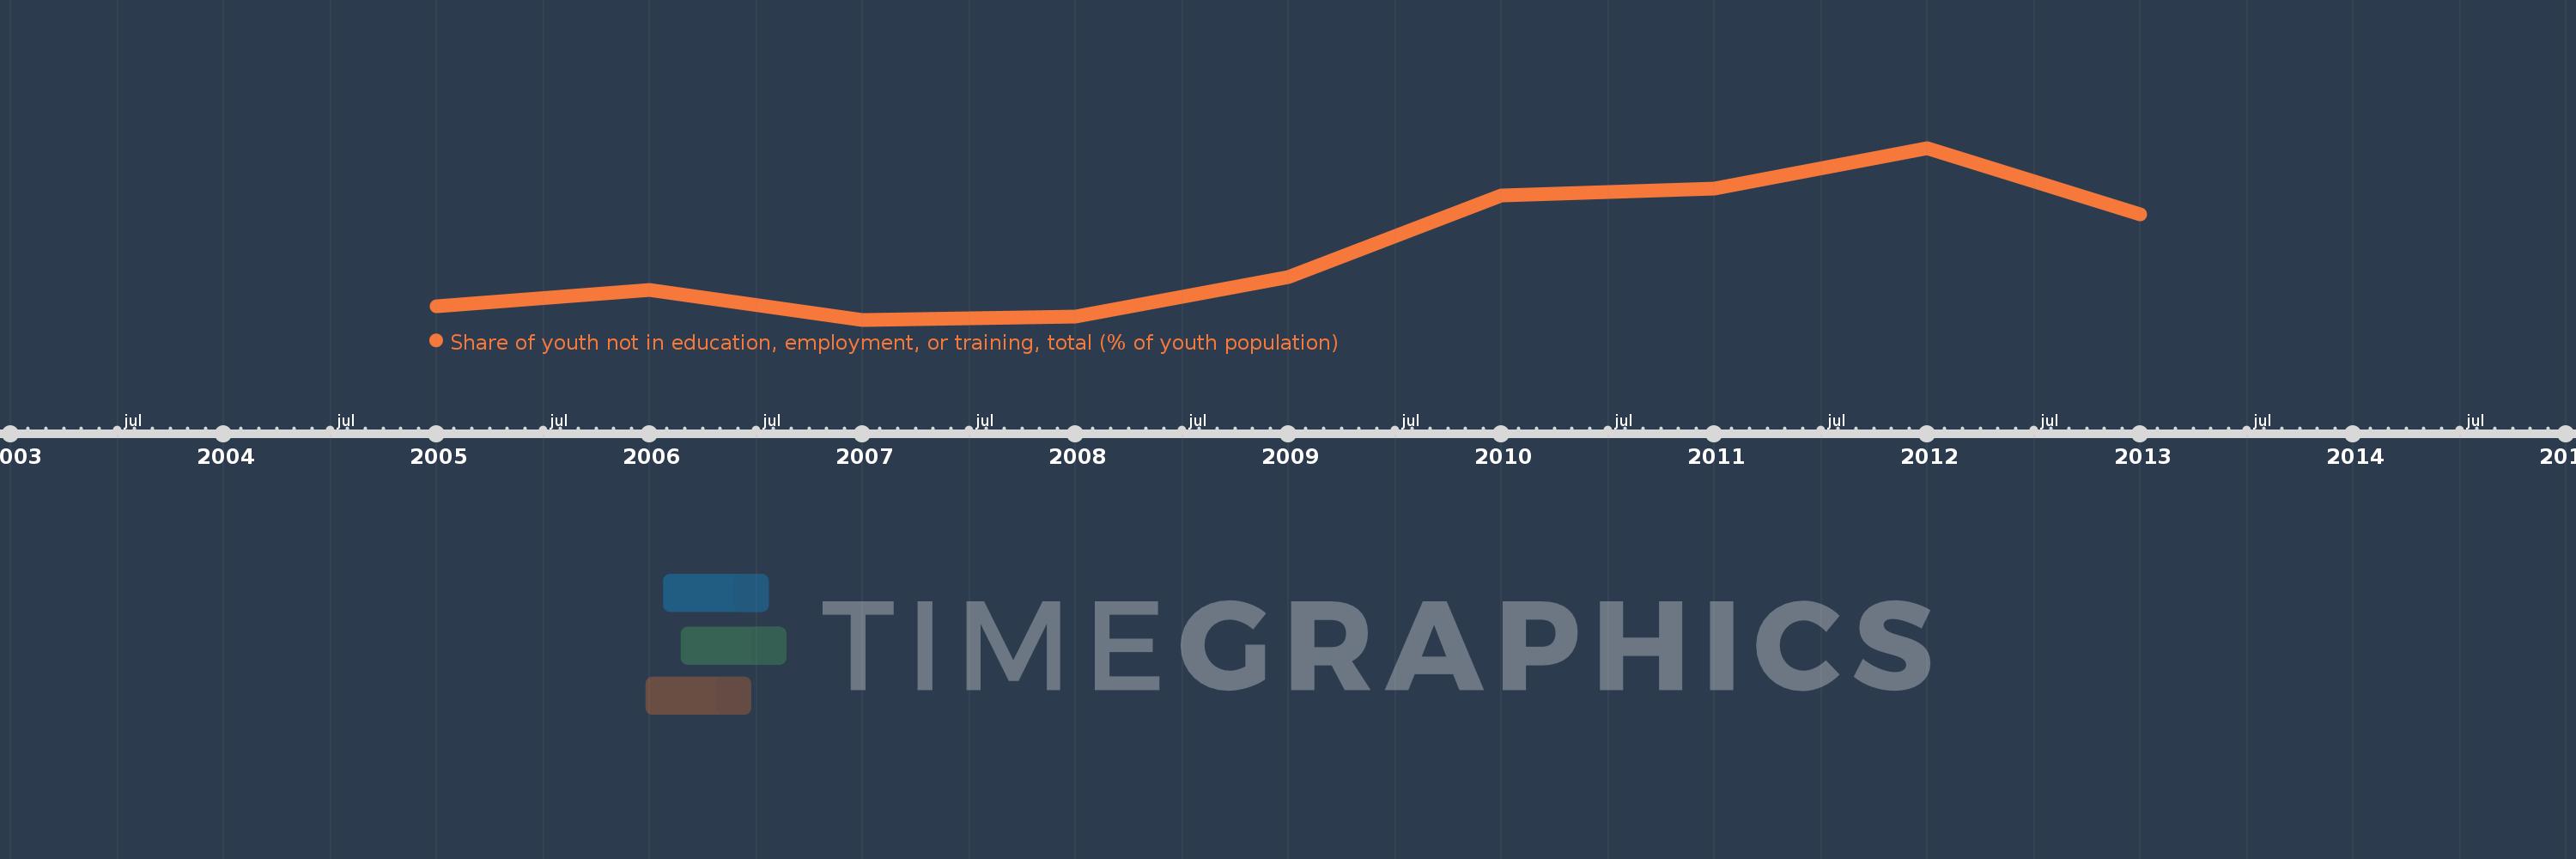
Questa scala temporale mostra un grafico dal 2005 anno al 2013 anno. Post-demographic dividend. I dati fino ad 2004 anno non disponibili. Il numero di osservazioni attuali secondo i date: 9.
La fonte (nome):
Indicatori dello sviluppo mondiale
La fonte (organizzazione):
International Labour Organization, Key Indicators of the Labour Market database.
Categorie:
Social Protection & Labor
sono stati aggiornati
23 apr 2017 anni
Indicatori delle variazioni dei valori per anni
In media:
12.314
Minima:
10.805
1 gen 2007 anni
Massimo:
14.556
1 gen 2012 anni
Alla data di osservazione
Valore
Variazione assoluta
La variazione rispetto al valore precedente
1 gen 2005 anni
11.098
+11.098
0.0%
1 gen 2006 anni
11.454
+0.355
3.2%
1 gen 2007 anni
10.805
-0.649
-5.67%
1 gen 2008 anni
10.872
+0.067
0.62%
1 gen 2009 anni
11.737
+0.865
7.96%
1 gen 2010 anni
13.527
+1.79
15.25%
1 gen 2011 anni
13.669
+0.142
1.05%
1 gen 2012 anni
14.556
+0.887
6.49%
1 gen 2013 anni
13.109
-1.447
-9.94%
Classificazione dei paesi secondo i statistiche attuali per anni