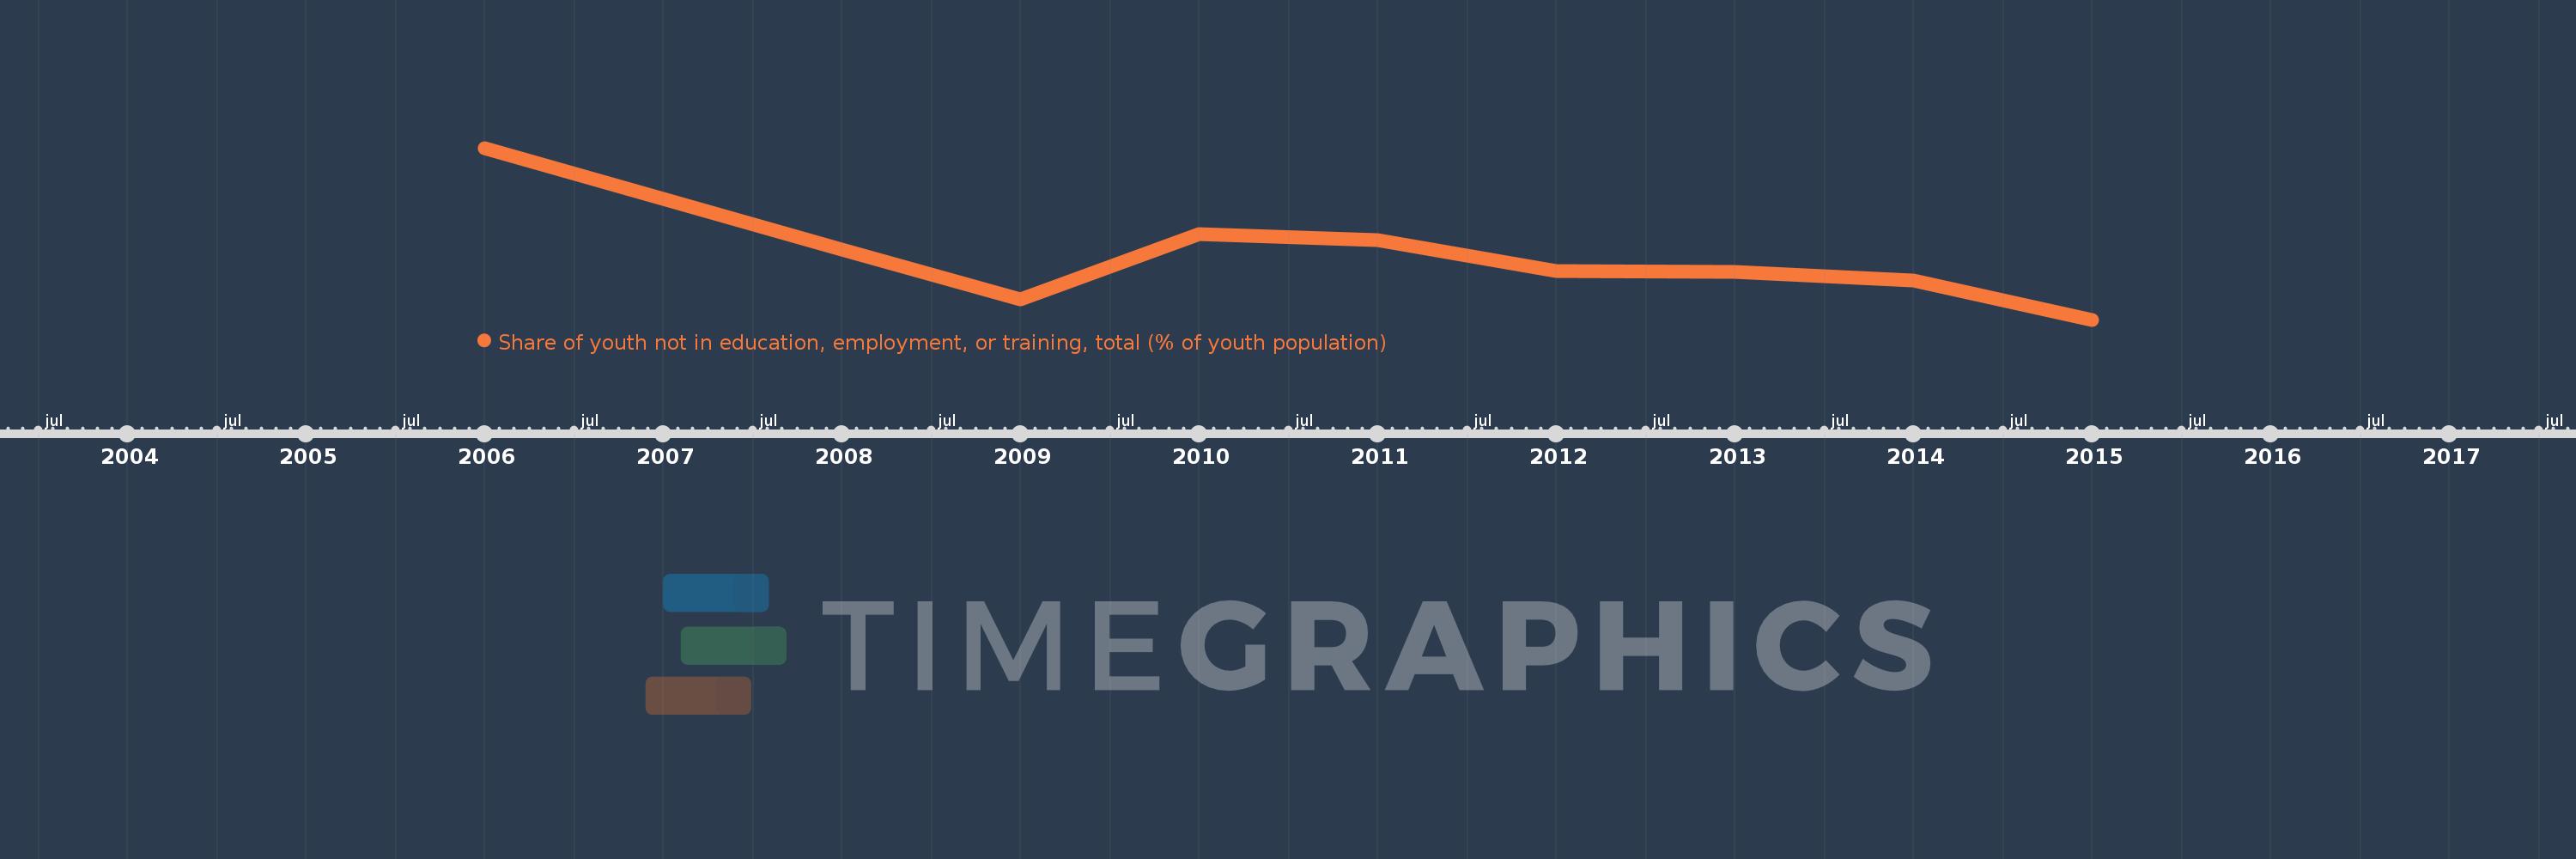
Questa scala temporale mostra un grafico dal 2006 anno al 2015 anno. Europe & Central Asia. I dati fino ad 2005 anno non disponibili. Il numero di osservazioni attuali secondo i date: 9.
La fonte (nome):
Indicatori dello sviluppo mondiale
La fonte (organizzazione):
International Labour Organization, Key Indicators of the Labour Market database.
Categorie:
Social Protection & Labor
sono stati aggiornati
23 apr 2017 anni
Indicatori delle variazioni dei valori per anni
In media:
15.78
Minima:
14.834
1 gen 2015 anni
Massimo:
17.428
1 gen 2006 anni
Alla data di osservazione
Valore
Variazione assoluta
La variazione rispetto al valore precedente
1 gen 2006 anni
17.428
+17.428
0.0%
1 gen 2008 anni
15.899
-1.529
-8.77%
1 gen 2009 anni
15.139
-0.76
-4.78%
1 gen 2010 anni
16.128
+0.989
6.53%
1 gen 2011 anni
16.042
-0.086
-0.53%
1 gen 2012 anni
15.565
-0.476
-2.97%
1 gen 2013 anni
15.554
-0.011
-0.07%
1 gen 2014 anni
15.431
-0.124
-0.8%
1 gen 2015 anni
14.834
-0.597
-3.87%
Classificazione dei paesi secondo i statistiche attuali per anni